

 might be primed for a price reversal.")
Despite the formation of a bullish triple-bottom pattern, Cardano’s (ADA) price has struggled to trigger any upward movement. Following the breakout, ADA has experienced a notable absence of momentum, resulting in a return to its pre-breakout levels.
Could the Triple Bottom Pattern Trigger a Reversal in ADA’s Trend?
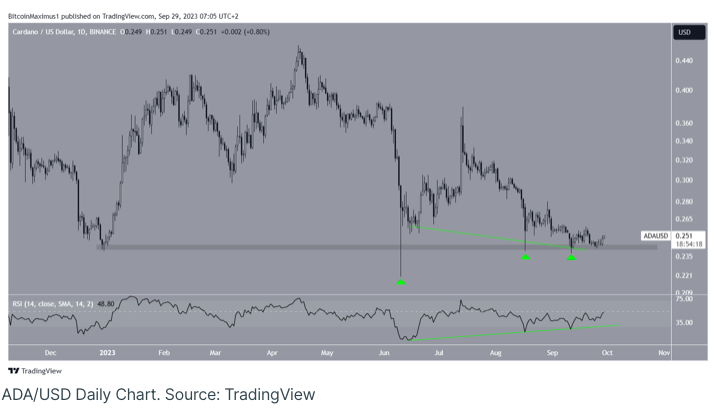
On the daily timeframe, technical analysis reveals that ADA’s price has been on a decline since reaching its yearly peak of $0.46 in April, eventually hitting a low point of $0.22 on June 10.
Subsequently, Cardano experienced a rebound, characterized by a notable extended lower wick (indicated by the green icon), thereby confirming the $0.24 level as a solid support.
For straightforward cryptocurrency investment insights, check out ADA price predictions here.
Following this bounce, ADA revisited the $0.24 horizontal support area twice, first on August 17 and then on September 11, both marked by green icons. This sequence effectively established a triple bottom pattern, traditionally regarded as a bullish sign.
Nevertheless, despite the formation of this bullish pattern, ADA has yet to exhibit any substantial upward movement.
However, the daily RSI provides support for the ongoing upward momentum in ADA’s price. Traders commonly employ the RSI as a momentum indicator to gauge whether a market is in an overbought or oversold condition and to make decisions about accumulating or selling an asset.
When the RSI reading surpasses 50 and the trend remains upward, it indicates that bulls maintain the upper hand. Conversely, if the reading falls below 50, the opposite is usually true.
Notably, the RSI has exhibited substantial bullish divergence throughout the triple bottom pattern. This phenomenon occurs when a surge in momentum accompanies a decline in price, often signaling an impending bullish trend reversal.
ADA Price Forecast: A Short-Term Breakout Could Trigger a Reversal
Upon closer examination of its movement, ADA exhibited a breakout from a descending resistance trendline on September 15.
Despite failing to kickstart an immediate upward trend, it’s conceivable that the price is in the process of validating the former resistance trendline as a newfound support. This is a customary occurrence following breakouts.
Consequently, the most plausible trajectory for ADA’s price in the near future is an upward move, targeting at least the $0.31 resistance zone. This level corresponds to both the 0.5 Fib retracement resistance level and a horizontal resistance zone, lying 22% above the current price.
A successful reclamation of this zone would not only confirm the presence of the triple bottom pattern but also validate the anticipated bullish trend reversal.

In contrast to the optimistic ADA price forecast, if the price dips below the $0.24 horizontal zone, it will nullify both the extended-term triple bottom pattern and the short-term bullish trend.
Under such circumstances, there’s a heightened probability of a 20% decline, potentially leading ADA’s value down to $0.20.