


The Bitcoin price is currently in a consolidation phase above the critical $26,000 support level. The potential for a recovery rally exists if Bitcoin successfully clears the resistance zone around $26,500 in the near future.
Presently, Bitcoin remains within a consolidation pattern above the vital $26,000 support region.
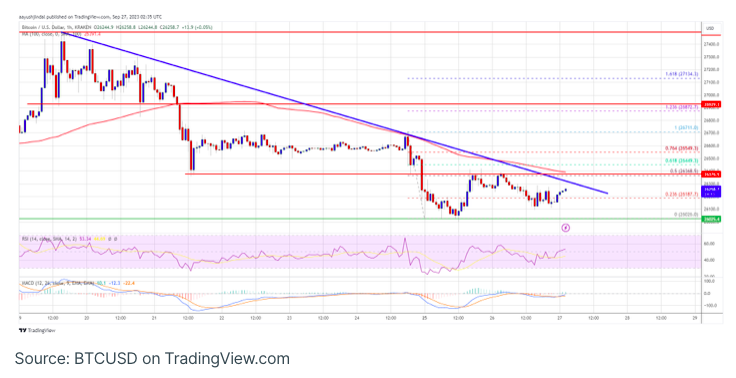
The price is trading below $26,400 and is positioned beneath the 100-hourly Simple Moving Average.
Additionally, there’s a significant bearish trend line taking shape, with resistance approximately at $26,300, as depicted on the hourly chart of the BTC/USD pair (data sourced from Kraken).
Unless there’s a clear breach below $26,000, there’s a possibility of a noteworthy recovery rally in the offing.
The Bitcoin price is setting its sights on a potential recovery.
Bitcoin’s price has maintained stability above the crucial $26,000 support zone. It appears that BTC is in the process of establishing a short-term support base above this level and is presently engaged in a consolidation phase.
In a recent move, the price attempted a recovery wave above the $26,200 level. However, the bears remained active, particularly below the $26,500 mark, as they rejected the 50% Fibonacci retracement level of the decline from the $26,712 high to the $26,026 low.
Currently, Bitcoin is trading below both $26,400 and the 100-hourly Simple Moving Average. Immediate resistance on the upside is situated near the $26,300 level. Furthermore, there’s a significant bearish trend line forming, presenting resistance around the $26,300 mark, as observed on the hourly chart of the BTC/USD pair.
The subsequent significant resistance level could be approximately $26,350 or the 100-hourly Simple Moving Average. If Bitcoin manages to surpass this resistance, it may revisit the $26,500 resistance or even the 76.4% Fibonacci retracement level of the decline from the $26,712 high to the $26,026 low.
In order to initiate a recovery momentum, it’s essential for the price to establish stability above the $26,500 mark. If this scenario unfolds, the price may ascend towards the $27,000 resistance. Further upward momentum could potentially set the stage for a move toward the $27,500 level.
More Losses In BTC?
If Bitcoin is unable to initiate a fresh upward movement beyond the $26,300 resistance, it may persist in a downward trajectory. Immediate support on the downside is located around the $26,050 level.
The subsequent significant support level can be found near the $26,000 mark. A breakdown below and subsequent closure beneath the $26,000 threshold could potentially trigger a more substantial decline. The next support level is positioned at $25,400, and further losses might prompt a test of the $25,000 level.
Technical indicators:
Hourly MACD – The MACD is currently exhibiting diminishing bearish momentum.
Hourly RSI (Relative Strength Index) – The RSI for BTC/USD is presently hovering around the 50 level.
Key Support Levels – $26,050, followed by $26,000.
Key Resistance Levels – $26,300, $26,500, and $27,000.