


Bitcoin’s Previous All-Time High: $69,000 in November 2021; It Has Now Been 22 Months Since That Peak. While Speculating on Bitcoin’s Future Price is Valuable, Timing Its Next Peak is Equally Crucial.
Past trends indicate that this milestone might still be on the horizon, with analysis pointing to a potential Bitcoin peak occurring towards the close of 2025.
Past Iterations
Observing Historical Trends: A Consistent Pattern Emerges
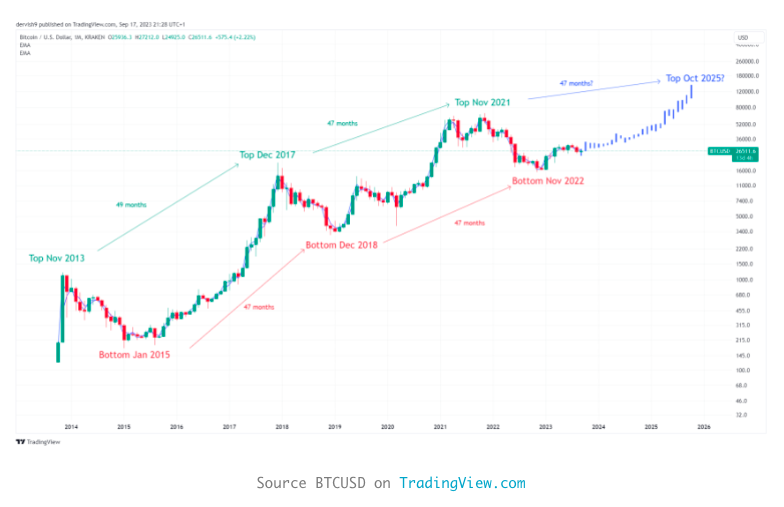
When analyzing the historical data, a discernible pattern emerges in the timing of previous market peaks and troughs. Notably, the three preceding market bottoms—January 2015, December 2018, and November 2022—all exhibited a consistent 47-month interval between them. Similarly, the three prior market peaks—November 2013, December 2017, and November 2021—displayed intervals of either 49 or 47 months.
Should this pattern persist, market participants might anticipate the next Bitcoin peak to manifest somewhere in the timeframe of October to December 2025. Subsequently, the following market bottom could potentially materialize around October 2026.
The Cyclical Nature of Peaks and Troughs: A Common Belief in Investing
The concept of peaks and troughs occurring in a cyclical fashion is a prevalent belief in the realm of investing. It’s widely acknowledged that both stock markets and economies undergo cycles of expansion, characterized by heightened economic activity and upward stock market trends. Conversely, there are phases of contraction, during which stock market prices decline, and economic growth decelerates.
What adds to Bitcoin’s intrigue is its reliable tendency to establish its highs and lows at approximately four-year intervals. A commonly cited explanation for this recurring pattern is the “halving theory.”
The Theory of Halving
The Halving Mechanism: Every approximately four years, Bitcoin experiences a “halving” event. During this event, the reward for mining new blocks, representing the fresh supply of Bitcoin, is reduced by half. This fundamental mechanism guarantees the scarcity of Bitcoin, which is capped at a maximum supply of 21 million coins. According to a basic economic principle, when supply diminishes while demand remains constant or grows, prices tend to rise.
Examining historical data, Bitcoin has consistently reached a new peak roughly one year after each halving event. With the next halving projected to take place in April 2024, this aligns with the aforementioned chart, suggesting that the next Bitcoin peak could materialize around the close of 2025.
The Upcoming Bitcoin Peak – Will We Witness a Distinct Scenario?
Interpreting Historical Data and Anticipating Bitcoin’s Future:
While historical data offers valuable insights into potential asset performance, it’s crucial to recognize that history doesn’t always precisely replicate itself; instead, it often exhibits similar patterns. This implies that while certain past trends may reappear, they may not unfold in the same manner.
Numerous factors, including technological advancements, macroeconomic conditions, and regulatory shifts, can introduce variations.
In the present market environment, Bitcoin is navigating uncharted territory characterized by high inflation and elevated interest rates. These conditions can potentially reduce market liquidity, as investors may have less capital available for investment.
Furthermore, in response to such a landscape, many investors may seek refuge in savings or bonds, which could offer more appealing and stable returns compared to other assets.
Investment Disclaimer: The content provided in this article is for informational and educational purposes only. It should not be construed as investment advice. Please consult a financial advisor before making any investment decisions. Trading and investing involve substantial financial risk. Past performance is not indicative of future results. No content on this site constitutes a recommendation or solicitation to buy or sell any securities or cryptocurrencies. Images sourced from iStockPhoto, Charts from TradingView.com.