


Litecoin’s price encountered significant selling pressure, resulting in a breakdown of the $80 trendline. As a result, LTC has dipped to around the $65 support level. Additionally, LTC has formed a double bottom pattern and is currently attempting to surpass the 20-day EMA in order to recover and potentially reverse its recent losses.
However, for the bulls to successfully initiate a reversal, they will need to muster strong momentum to overcome the resilient bears. LTC had made multiple attempts to breach the $100 cluster but faced repeated rejections. The relentless bearish pressure pushed LTC back towards its initial levels and led to short-term price declines, ultimately breaking below the $80 support zone in recent sessions.
Litecoin’s (LTC) price currently stands at a critical juncture. If it can maintain support above $60 and attract continued buying interest, it may absorb the recent selling pressure and recover, aiming to reclaim the primary $80 level. Conversely, if it breaches the $60 support, it could trend lower towards $50, potentially entering a free fall. Nevertheless, there exists a robust support zone, and breaking the key $50 level may prove challenging for the bears.
At the time of writing, LTC is trading at $64.20, experiencing a 1.77% intraday decline, indicating a neutral sentiment in the market. Trading volume has increased by 4.75% to reach $286.99 million, while the LTC/BTC pair is at 0.00242 BTC. Litecoin’s market capitalization stands at $4.58 billion. Additionally, analysts maintain a neutral outlook and anticipate potential growth in the upcoming sessions.
Litecoin (LTC) Price Exhibits Recent Downturn on Daily Charts
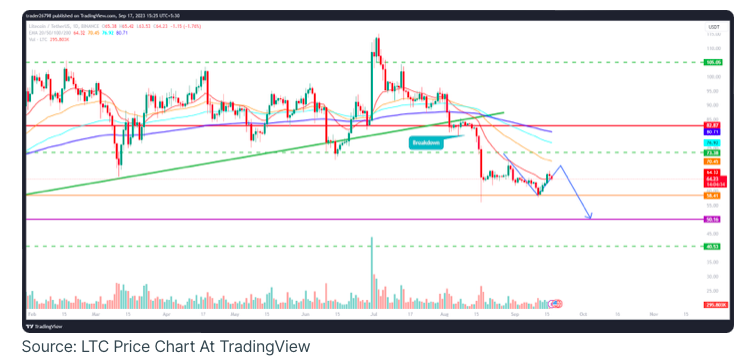
When examining the daily charts, LTC’s price is situated below crucial moving averages, and it has fallen into a bearish territory, reflecting a prevailing selling sentiment in recent sessions. Furthermore, sellers have continued to build short positions, aiming to push LTC closer to the $50 psychological level. Additionally, the trajectory of the price movement reinforces this notion, indicating the potential for further selling pressure in the upcoming sessions and the possibility of LTC descending towards the $50 mark in the near future.
The short-term chart reveals that LTC has encountered resistance at the 200-day EMA, indicating a rejection from this key moving average.
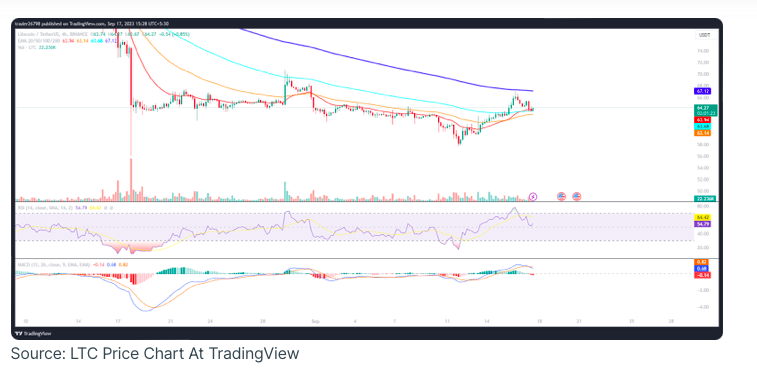
In the short-term analysis, LTC made an attempt to break above the 200-day EMA in pursuit of a reversal but encountered resistance, leading to additional retracement during recent trading sessions.
The RSI curve remained in the overbought region, indicating a bearish divergence and forming a bearish crossover, implying potential volatility in the upcoming sessions.
The MACD exhibited a bearish crossover and generated red bars on the histogram, signaling a pessimistic outlook for the forthcoming sessions.
Summary
Litecoin’s price is currently following a bearish trajectory, undergoing a recent selloff in the preceding sessions. Additionally, the price movement reflects the predominance of sellers, while buyers have adopted a cautious approach and begun to close their long positions due to the breakdown. Investors will closely monitor the market for signs of a decisive rebound or the possibility of further selling pressure in the upcoming sessions.