


The Bitcoin price is encountering difficulties in reclaiming the $26,200 level, and it is once again showing signs of a downward movement, potentially leading to a significant drop below $25,500 in the short term.
Bitcoin’s attempts to breach the $26,200 and $26,500 thresholds have fallen short.
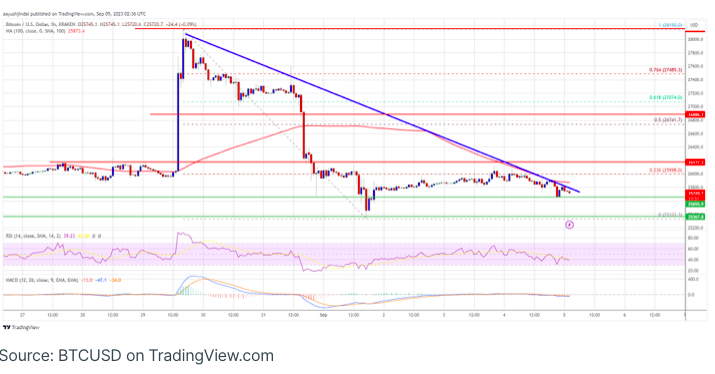
Currently, the price is trading below $26,000 and the 100-hourly Simple Moving Average.
On the hourly chart of the BTC/USD pair (data sourced from Kraken), a notable bearish trend line is emerging, with resistance hovering around $25,650.
In the near future, there is a possibility that the pair may experience an accelerated decline, potentially dipping below the $25,500 and $25,400 support levels.
The Bitcoin price has resumed its downward trajectory.
Bitcoin’s price recently made an attempt to stage a recovery from the $25,350 region. However, it faced significant challenges in surpassing the crucial $26,200 pivot level, ultimately keeping it within a bearish context.
Presently, the price is once again trending downwards and is trading below the $26,000 threshold. There is a multitude of bearish indicators manifesting beneath $26,000, including the 100-hourly Simple Moving Average. Additionally, an important bearish trend line is taking shape on the hourly chart of the BTC/USD pair, featuring resistance around the $25,650 mark.
On the upside, immediate resistance can be found near the $25,650 level and the aforementioned trend line. The primary resistance level lies around the $26,000 mark, or the 23.6% Fibonacci retracement level of the recent downward movement from the $28,150 swing high to the $25,332 low.
The upcoming significant hurdle stands at approximately the $26,200 mark. If there is a decisive breakthrough beyond this level, it could potentially initiate a substantial upward trend towards $26,500. Beyond that, a noteworthy resistance barrier looms around $27,000, and surpassing it might trigger a substantial uptick. Under such circumstances, the price may explore the $27,800 level.
More Losses In BTC?
Should Bitcoin fail to overcome the resistance at $26,000, it may persist in its downward trajectory. Immediate support on the downside is situated around the $25,350 level.
Subsequently, the next significant support rests near the $25,000 threshold. A breach below $25,000 could potentially propel the price further downwards. In such a scenario, there’s a possibility of a decline towards the $24,500 level.
Technical indicators to consider:
- Hourly MACD: The MACD is currently showing increasing bearish momentum.
- Hourly RSI (Relative Strength Index): The RSI for BTC/USD is presently above the 50 level.
Key Support Levels: $25,350, followed by $25,000.
Key Resistance Levels: $25,650, $26,000, and $26,200.