


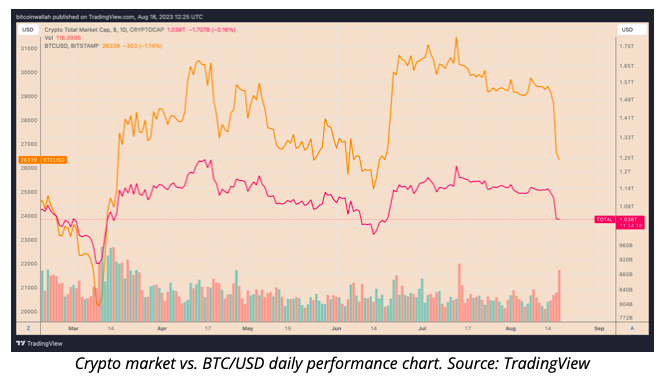
On August 19, the cryptocurrency market continued to experience a decline in price trends, while the total market capitalization aimed to remain above the $1 trillion mark.
Bitcoin (BTC), represented by the ticker symbol “BTC,” saw its price decrease to $25,894, and it struggled to maintain the $26,000 level as the market transitioned into the weekend.
Bitcoin Takes the Lead in Crypto Market Declines
The significant downward movement this week took place on August 17, spurred by reports of Elon Musk’s SpaceX liquidating its Bitcoin holdings and several other significant factors.
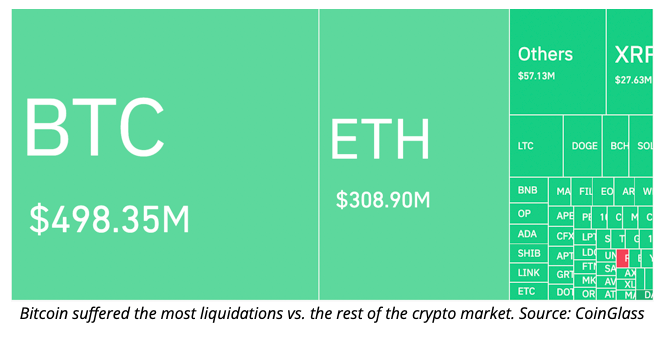
Bitcoin, holding a dominant share of almost 50% in the overall cryptocurrency market, responded unfavorably to the SpaceX announcement. The sell-off intensified amidst a “bloodbath” characterized by increasing liquidations in the cryptocurrency derivatives market.
By August 18th, approximately 176,300 traders had executed liquidations on contracts totaling $1.04 billion in value, with nearly 80% of these being long exits. Essentially, a long squeeze compelled traders to sell at a loss in order to mitigate the risk of even greater losses.
Cryptocurrency Faces Downward Pressure Amid Macro Risks
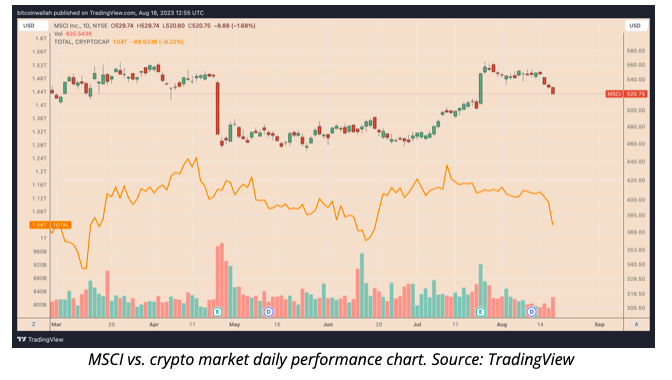
The crypto market’s downturn paralleled the losses observed in the worldwide stock market.
Significantly, the MSCI World Index, encompassing major and mid-cap stocks from twenty-three developed nations, experienced a substantial decline on August 17, as depicted in the accompanying chart. This synchronized with increasing concerns regarding China’s economic condition and the prospect of elevated interest rates.
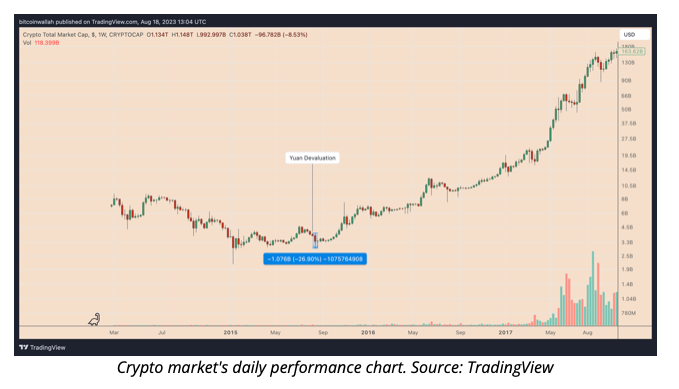
The economic downturn in China has sparked apprehensions that their central bank might devalue the yuan as a measure to stimulate their economy. This action could have adverse effects on the cryptocurrency market, especially in the near term.
During the previous instance of China’s yuan devaluation in August 2015, the BTC price saw a 23% decline in the subsequent two weeks, while the broader crypto market experienced a 27% loss within the same timeframe.
“Head-and-shoulders” Pattern Suggests Further Distress
Meanwhile, the technical indicators in the cryptocurrency market are also not conveying an optimistic outlook. The ongoing decline is shaping a potential head-and-shoulders (H&S) pattern on the weekly chart, heightening expectations for further losses in 2023.
The H&S pattern is a bearish reversal signal that usually confirms after the price breaches its support line (or neckline). By August 18th, the cryptocurrency market had tested the H&S neckline in preparation for a possible breakdown move.
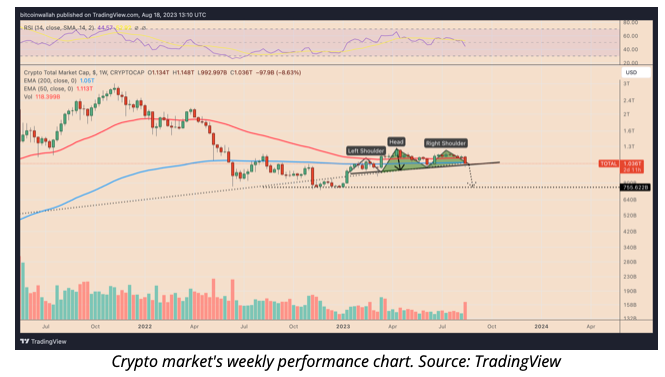
If the pattern unfolds as projected, its potential downward target for the conclusion of 2023 or the beginning of 2024 would be approximately $751 billion, representing a decline of more than 25% from the current valuation.
Conversely, the bullish sentiment will strive for a rebound towards the 50-week exponential moving average (50-week EMA; depicted by the red wave) situated around $1.113 trillion in 2023.
Sustaining the critical support of the 200-week EMA (represented by the blue wave) at approximately $1.08 trillion will hold significant importance for the bulls as they progress.