Dogecoin (DOGE), the leading meme coin, has recently experienced a dramatic surge, soaring 111% over the past week to reach a three-year high of $0.40.
However, technical indicators hint that this rally could be losing steam, with a potential pullback on the horizon.
Dogecoin Shows Signs of Being Overbought
Dogecoin’s price has risen 7% in the last 24 hours, but its trading volume has dropped by 33% in the same period, signaling an uptick in selloffs.
When an asset’s price climbs while trading volume decreases, it often indicates waning momentum. A drop in volume during a price rise suggests fewer buyers at these elevated levels, pointing to reduced demand. This divergence can be a bearish indicator, showing that the rally lacks the strong buying support necessary for lasting growth.

Dogecoin Price and Trading Volume. Source: Santiment
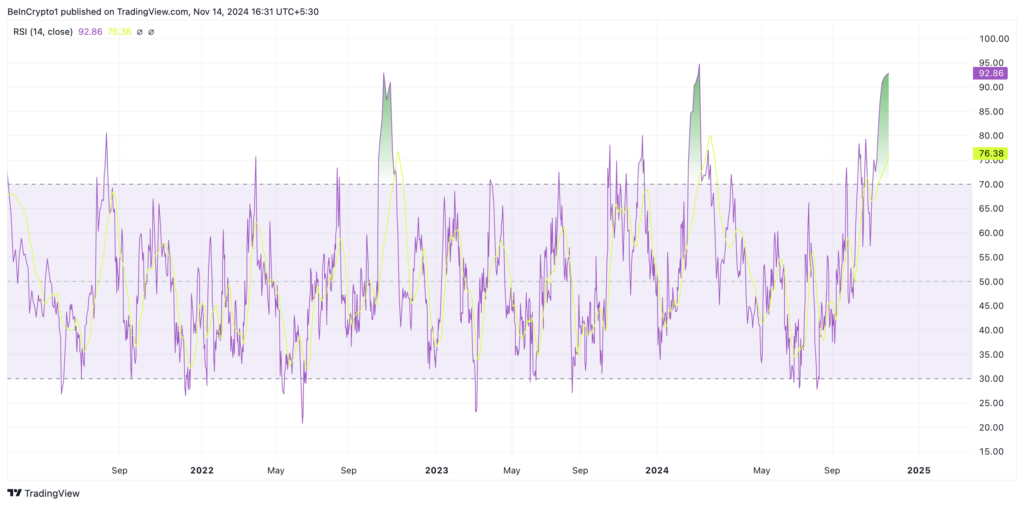
Additionally, the DOGE/USD one-day chart suggests that Dogecoin is currently overbought and likely due for a pullback. The first signal of this is the coin’s Relative Strength Index (RSI), which now stands at 92.86—the highest level since March.
The RSI is a metric that gauges whether an asset is overbought or oversold, with values ranging from 0 to 100. A reading above 70 indicates overbought conditions and a potential for a correction, while a reading below 30 suggests the asset is oversold and may be poised for a rebound.

Dogecoin RSI. Source: TradingView
With an RSI reading of 92.86, Dogecoin is highly overbought, suggesting an imminent price correction.
DOGE Price Prediction: Drop Below $0.30 Likely
Currently, DOGE’s price sits above the upper band of its Bollinger Bands indicator, further indicating a likely price retracement in the near term.

Dogecoin RSI. Source: TradingView
An RSI reading of 92.86 for DOGE indicates that it is heavily overbought, making a price correction likely in the near future.
DOGE Price Prediction: Potential Drop Below $0.30
DOGE’s current position above the upper band of its Bollinger Bands indicator reinforces the likelihood of a short-term price retracement.

Dogecoin Bollinger Bands. Source: TradingView
The Bollinger Bands indicator tracks market volatility and highlights potential buy and sell signals. It consists of three main parts: the middle band, upper band, and lower band.
When an asset’s price moves above the upper band, it may signal that the asset is overbought and overextended. Traders often view this as an indication of possible downward pressure, prompting them to sell and secure profits.
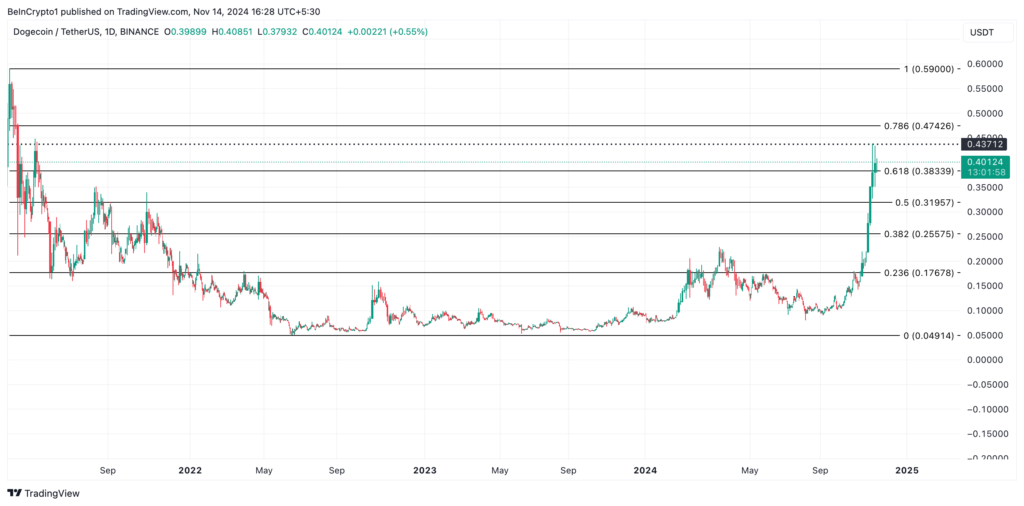
DOGE is currently trading at $0.40. Should a price correction occur, DOGE may first test support at $0.38. If buying pressure remains weak and this level doesn’t hold, the price could fall sharply to $0.31.
Continued selloffs could then push DOGE even lower, potentially reaching $0.25.

Dogecoin Price Analysis. Source: TradingView
If demand intensifies, Dogecoin’s price rally could climb to $0.43, its highest point in this bullish cycle, with potential to reach $0.47—a level not seen since May 2021.


