

 Price Soars: Bullish Patterns Suggest a Potential 4x Increase")
Litecoin (LTC) Sees Price Surge: Bullish Patterns Hint at Potential 4x Increase
Litecoin (LTC), the world’s 19th largest cryptocurrency by market cap, has experienced a notable price surge, pushing its market cap to $4.9 billion.
Over the past 24 hours, spot trading volume increased by 40%, reaching $410.08 million. This growth in activity led to a 24-hour volume/market cap ratio of 8.09%, indicating increased liquidity.
Grayscale Investments Holdings recently reported growth in Litecoin, hitting a high of 1.84 million LTCN shares. This heightened interest has driven Litecoin’s price surge, demonstrating its significant impact on the market.
According to on-chain research from IXFI, the number of active Litecoin addresses rose from 327.72K to 434.75K in just one day, highlighting increased trading and investing activities.
Is LTC poised for a 4x run before the end of 2024?
Litecoin has formed a descending triangle, a bullish pattern, on the weekly chart. The resistance, marked by an orange downward trendline, has been in place since 2021. The $50 support level has been steady since 2018.
After hitting a high of $413.91 in 2021, LTC entered a downtrend. By 2022, the bearish trend was confirmed as price activity fell below the 50-period EMA and 200-period EMA bands on the weekly chart.
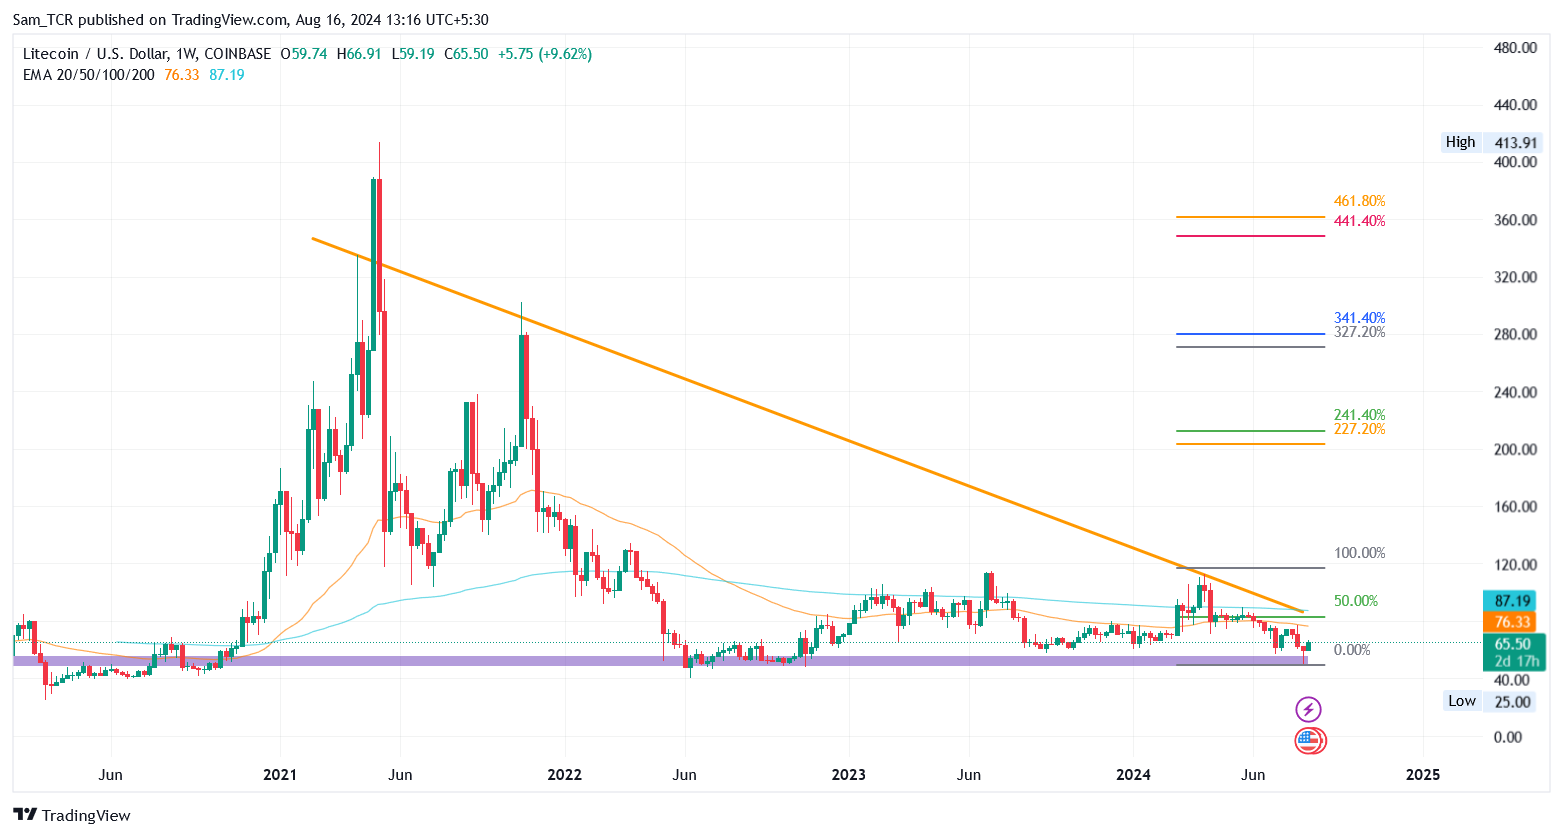
LTC 1W | Source: TradingView
Over the weekly chart, long-term targets can be achieved if a breakout occurs after successfully surpassing the $109 level, which marks a critical change of character (CHoCH).
Based on the Fibonacci retracement tool, potential targets are set at $210, $280, and $360.
Where is LTC Headed in the Short-Term?
On the daily chart, Litecoin reached a yearly high of $112 on April 1st, 2024. The price subsequently fell, establishing support this month at the historically significant $50 zone, dipping as low as $49.90 on August 5th.
In the past two weeks, LTC’s price has increased by over 32%, trading at $65.48 with nearly 4% intraday growth. The price appears set to break through the long-term descending trendline and the EMA bands from below.
Other oscillators on the daily chart suggest further growth potential. The MACD shows a bullish cross, with the histogram at 0.71, and the RSI curve has found support on the 14-SMA at 50.98.
Confirmation of further price movement can be achieved if LTC maintains its position above the CHoCH level of $74. Based on the Fibonacci retracement tool, short-term targets are $115, $145, and $176.