


Daily Digest Market Movers: Ethereum ETFs, Whale Activity, and On-Chain Signals
Ethereum ETFs Boost the Crypto Landscape
Ethereum ETFs recorded a net inflow of $155 million last week, according to CoinShares’ data. This marks the highest inflow among all digital assets, signaling that traditional investors took advantage of the market correction to buy ETH at lower prices. Notably, BlackRock’s iShares Ethereum ETF (ETHA) is nearing $1 billion in cumulative net inflows, having surpassed $900 million last week.
With outflows from Grayscale’s ETHE slowing and the broader market recovering, ETH ETFs could positively influence Ethereum’s price in the coming weeks.
Whale Activity and Potential Market Impact
However, bearish pressure might arise from the activity of old whales. Data from Lookonchain reveals that an Ethereum whale transferred 5,000 ETH worth $13.2 million to the OKX exchange recently. This whale, who has been depositing ETH to OKX since July, potentially aims to sell a total of 48,500 ETH valued at $154 million. The whale originally received 1 million ETH at $0.31 during Ethereum’s ICO and currently holds 303.5K ETH across two wallets.
Price Prospects and Resistance Challenges
Ethereum (ETH) saw a 1% increase on Monday, appearing poised for a potential 20% rally driven by buying momentum from traditional investors in ETH ETFs. However, it faces possible bearish pressure from the aforementioned whale activity and must overcome resistance around a key trendline.
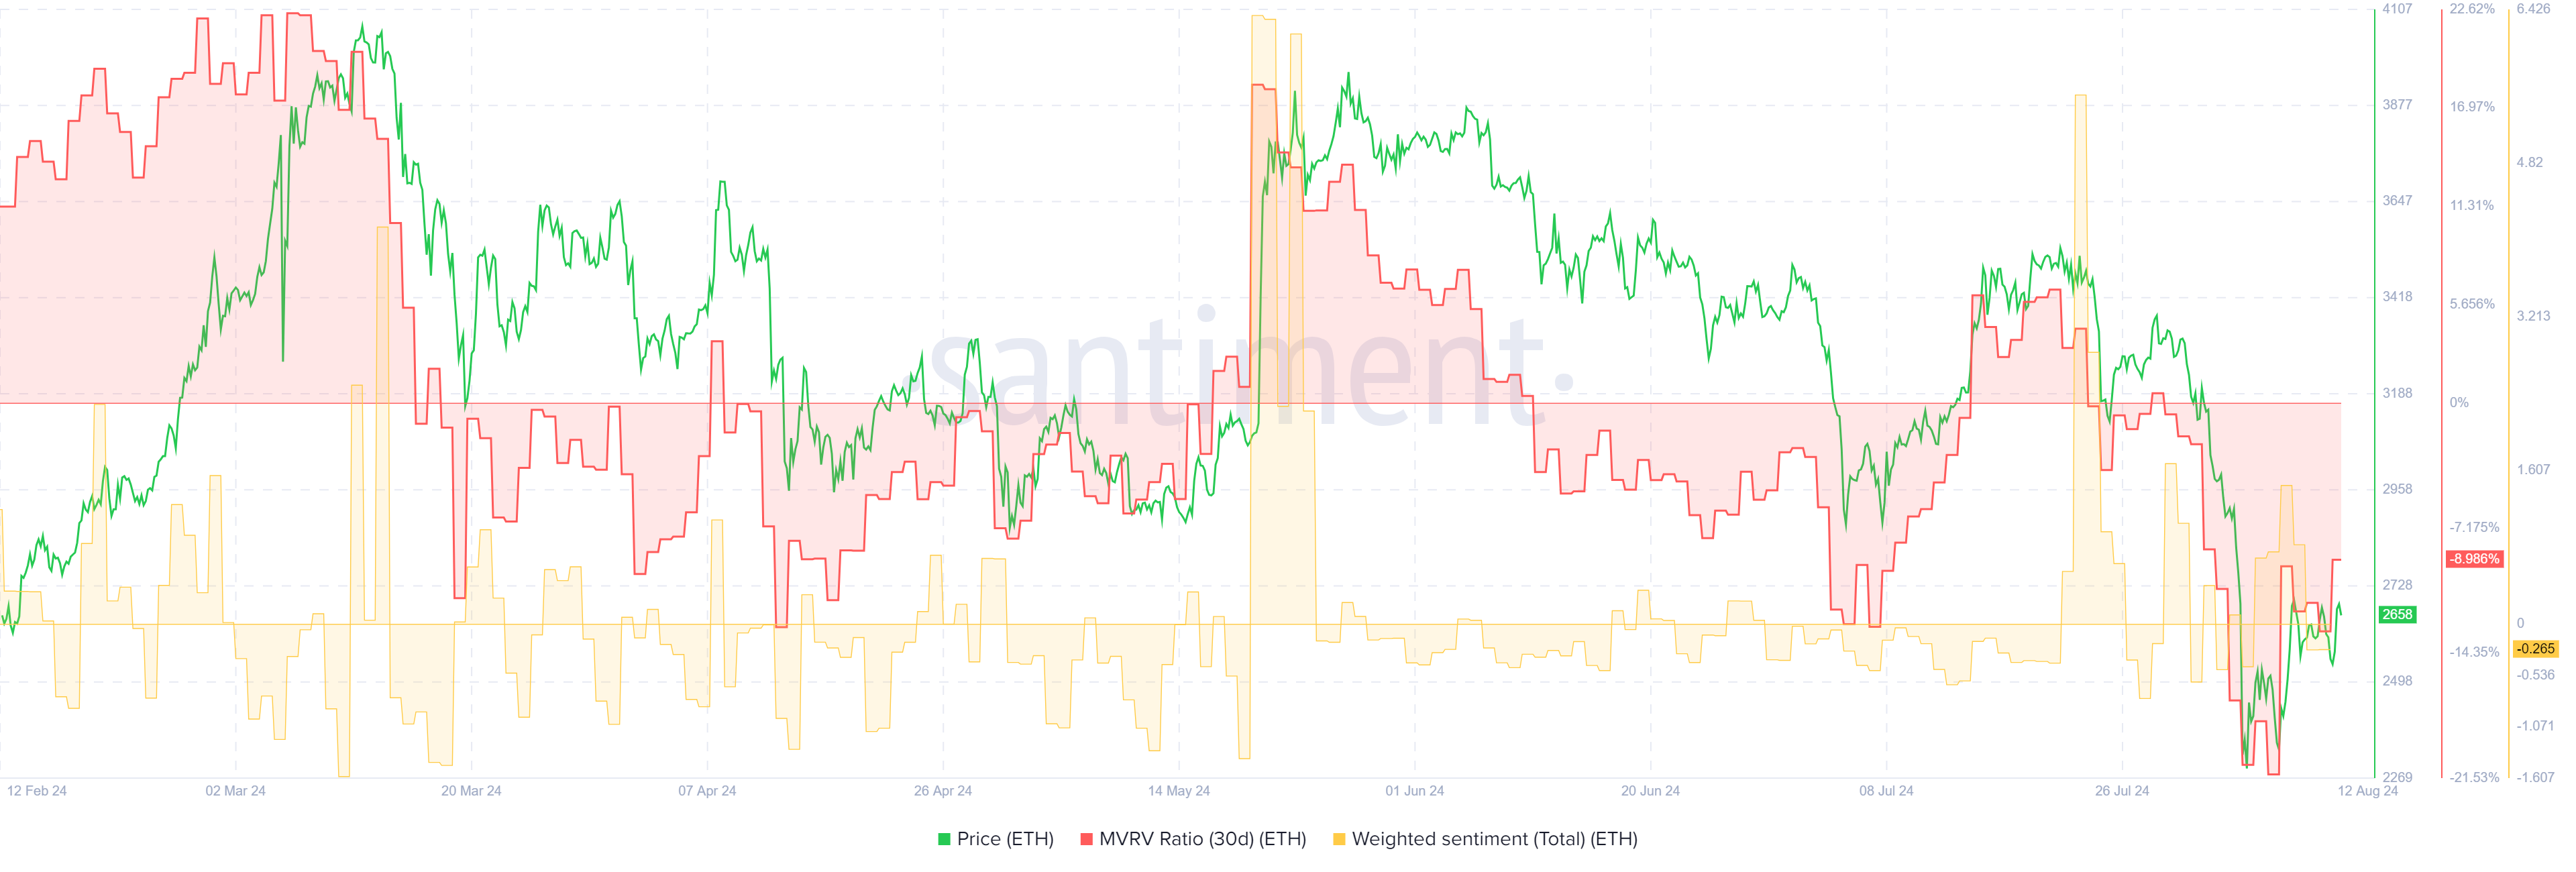
Ethereum’s 30-day Market Value to Realized Value (MVRV) Ratio indicates that all investors who purchased ETH in the last 30 days experienced an average loss of 9%. Additionally, ETH’s Weighted Sentiment stands at -0.2%, reflecting a slightly negative or low sentiment towards the altcoin. These on-chain metrics suggest that ETH might still be in the buy zone, setting the stage for a potential rally.
ETH Technical Analysis: Ethereum’s Potential for a 20% Rally Faces Key Trendline Hurdle
Ethereum (ETH) is trading around $2,660 on Monday, up over 1% for the day. In the past 24 hours, ETH has experienced $55.71 million in liquidations, with $35.09 million from long positions and $20.62 million from short positions.
ETH is currently attempting to break above the $3,723 resistance level, which it has failed to surpass twice in the past week. This resistance level aligns with a key trendline, indicating a potential decline to a swing low around the $2,020 price. As illustrated in the chart, ETH has exhibited similar movements from August 2022 to November 2022 and from July 2023 to October 2023.
ETH MVRV & Weighted Sentiment
Ethereum’s 30-day Market Value to Realized Value (MVRV) Ratio reveals that investors who bought ETH within the last 30 days have experienced an average loss of 9%. Additionally, the Weighted Sentiment for ETH is at -0.2%, reflecting a slightly negative or low sentiment towards the cryptocurrency. These on-chain metrics suggest that ETH may still be in the buy zone, setting the stage for a potential rally despite the resistance challenges.
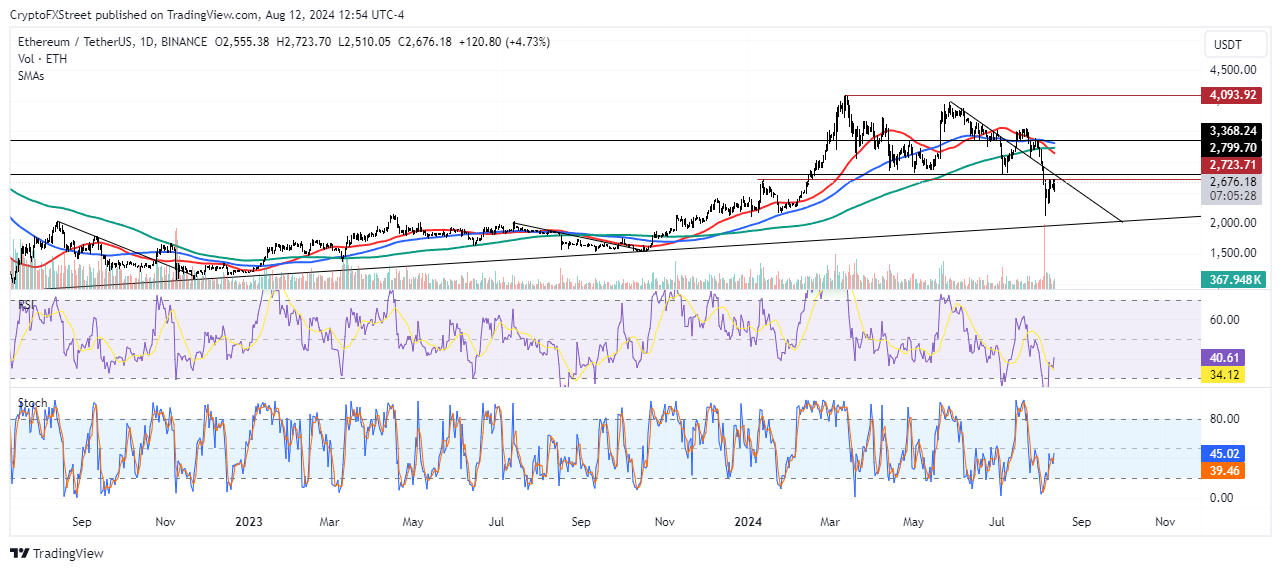
ETH Technical Indicators Signal Bullish Momentum Amid Key Resistance Challenges
The Relative Strength Index (RSI) at 41, crossing above its moving averages, suggests ETH is experiencing increased bullish momentum. This is further supported by the Stochastic Oscillator (Stoch), where the %K line crossed above the %D line again on Sunday, indicating a shift in momentum favoring buyers.
The potential bullish momentum is reinforced by ETH’s futures open interest (OI) increasing by over 4% to nearly $11 billion and the ETH Long/Short Ratio rising to 1.01. Rising OI during a price comeback attempt often signals potential for further growth.
As a result, ETH could rally over 20% to around $3,368, where it encounters key resistance. Additionally, the 100-day Simple Moving Average (SMA) could act as resistance after ETH posted a “Death Cross” on Thursday when the 50-day SMA crossed below the 100-day SMA.
This bullish outlook will be invalidated if ETH falls below the support level around $2,020, which also intersects with a key trendline.