Ethereum Price Analysis: ETH Trapped in a Tight Range Between Key Moving Averages
Ethereum’s price is currently oscillating within a narrow range, confined by the 100-day moving average at $3364 and the 200-day moving average at $3212. A breakout from this range will be crucial in determining the next direction of the price movement.
Technical Analysis
By Shayan
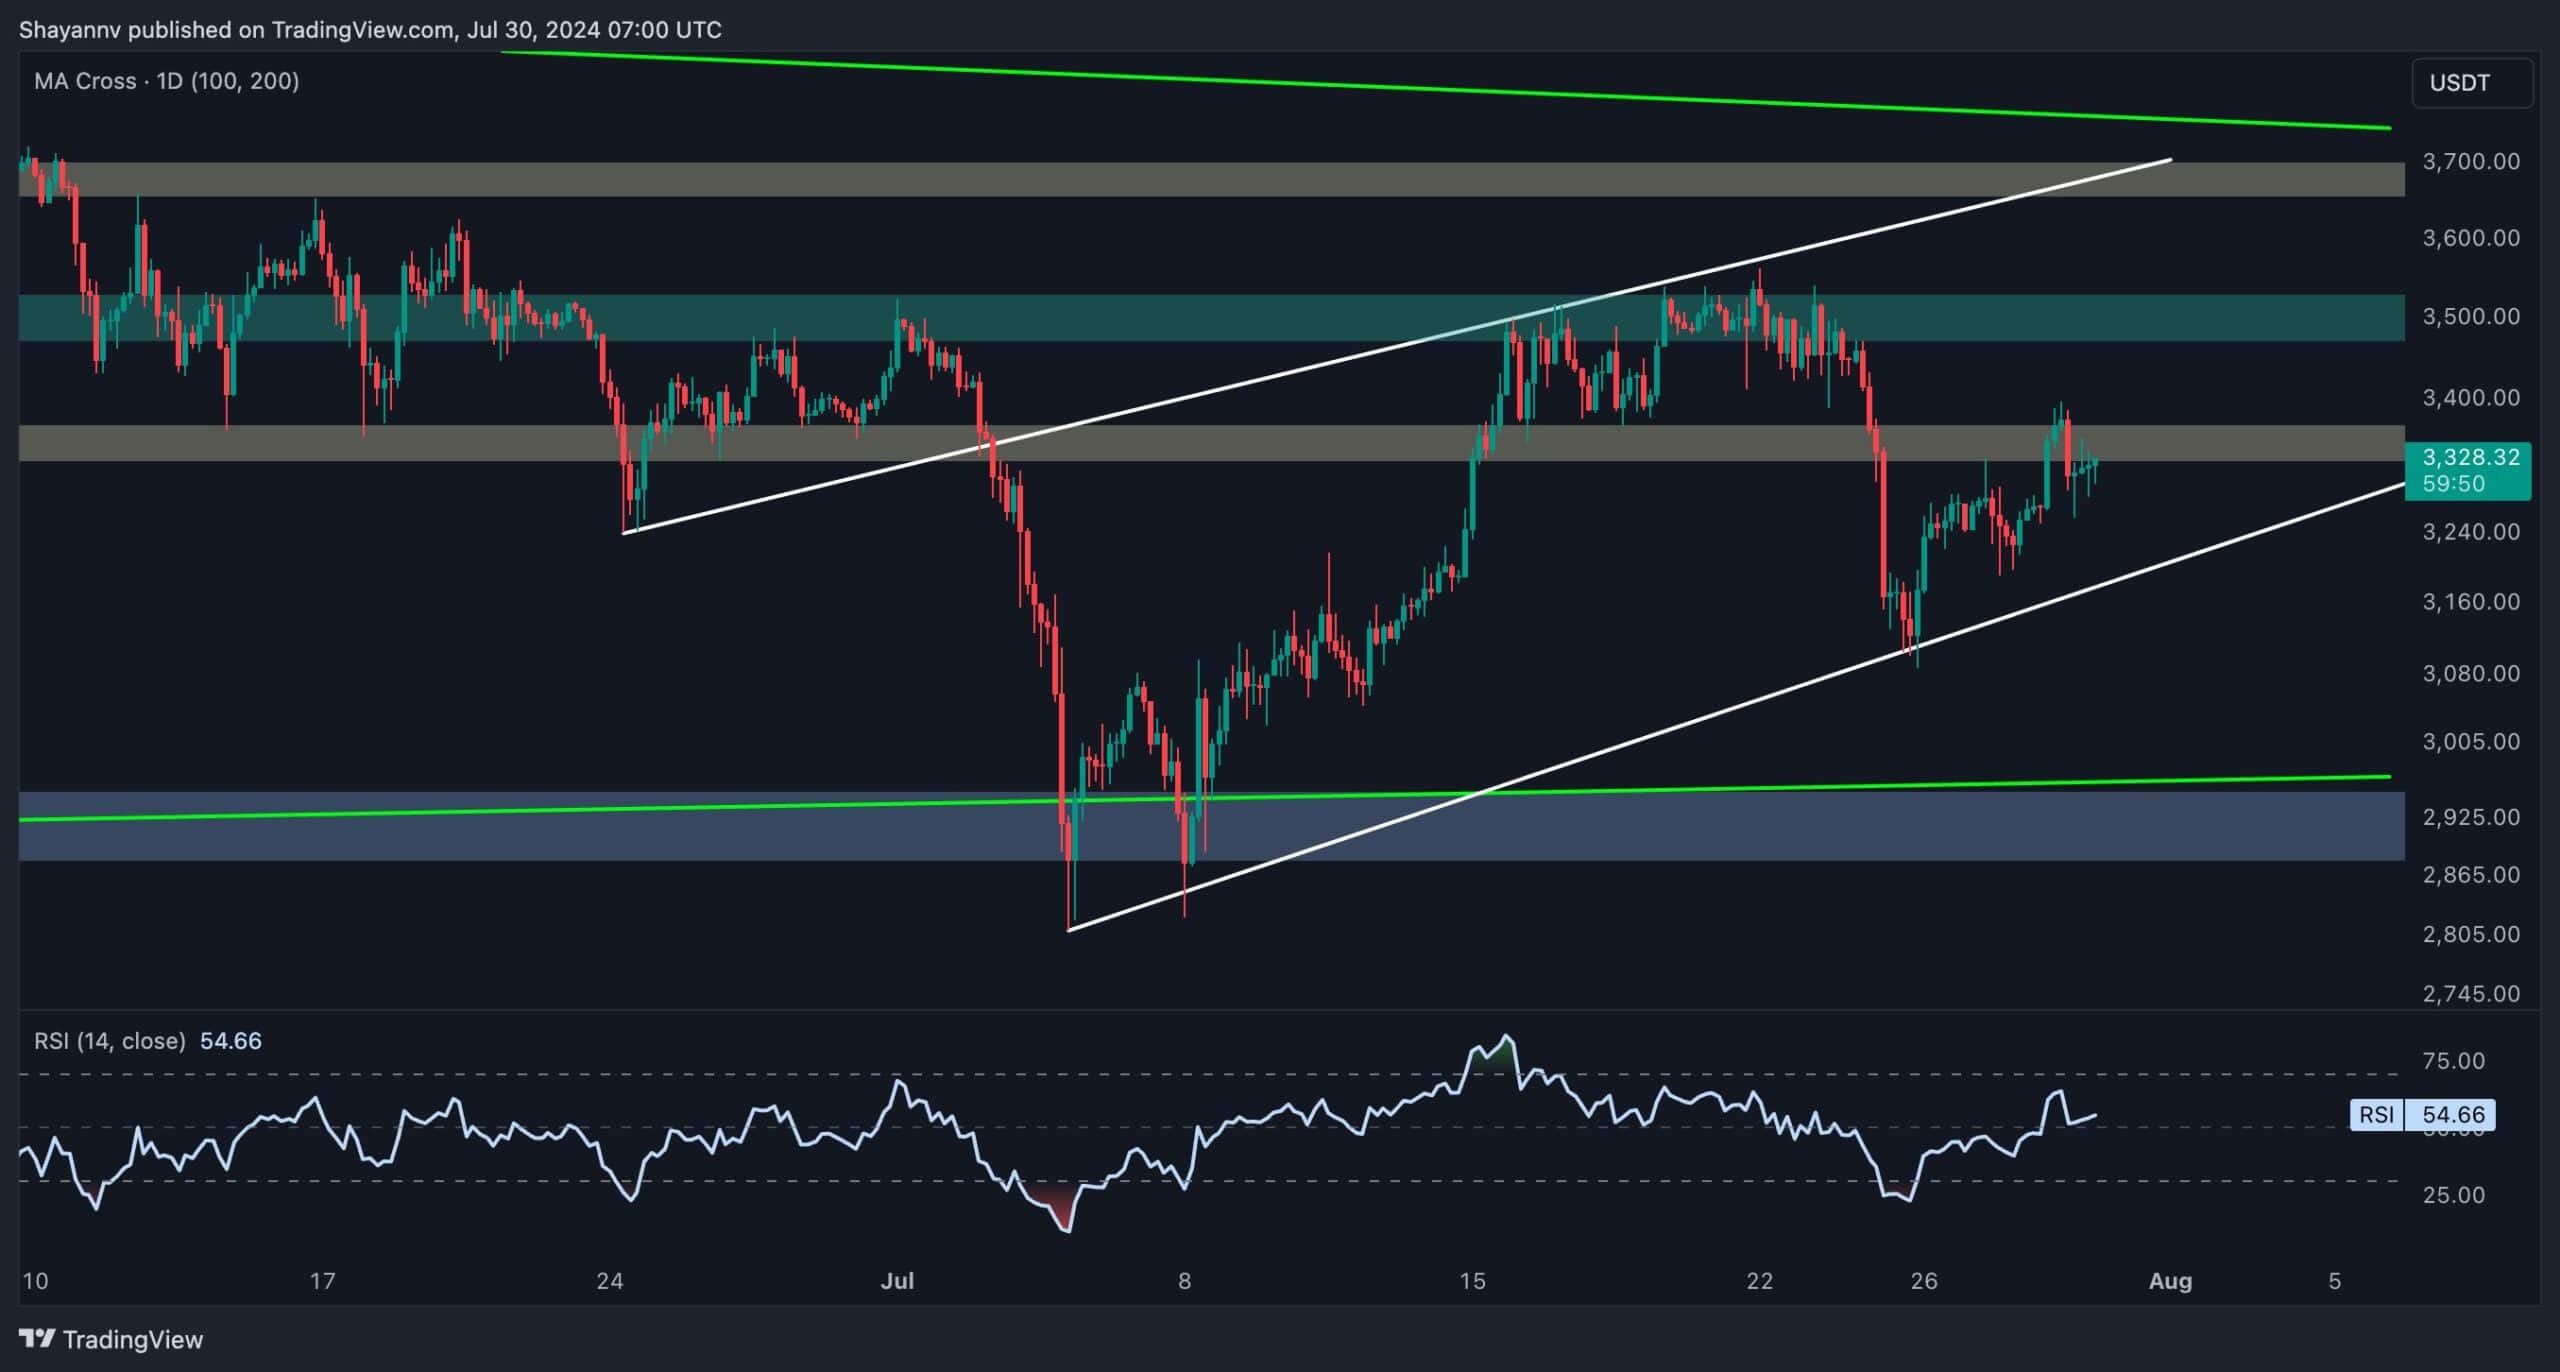
The Daily Chart
A close look at Ethereum’s daily chart shows that after being rejected near the significant $3.5K resistance region, the price has dropped to a major support zone. This critical support is underscored by the 200-day moving average at $3212, which acts as a strong defense line for Ethereum buyers.
Currently, the price is trapped within the tight range between the 100-day moving average at $3364 and the 200-day moving average at $3212. Breaking above this range could bring in enough demand to drive the price upward.
Conversely, a break below the 200-day moving average would indicate a bearish trend, potentially leading to a significant decline toward the crucial $3K support zone.
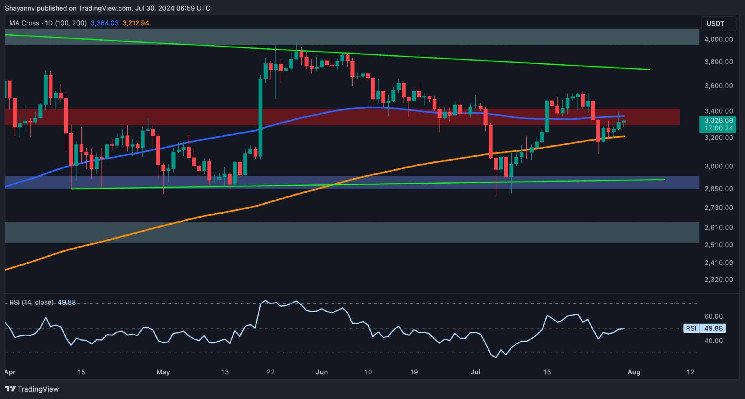
The 4-Hour Chart
On the 4-hour chart, Ethereum faced increased selling pressure near the critical $3.5K resistance, leading to a drop below $3.3K. This triggered an impulsive bearish descent toward the crucial $3K support region.
Following this sharp decline, Ethereum has entered a temporary consolidation phase, often seen after significant market moves. During this corrective stage, the price has retraced back toward the broken $3.3K threshold, forming an ascending wedge pattern.
This pattern suggests a continuation of the bearish trend if the price breaks below its lower boundary. Should the price fail to hold within the wedge and break downwards, a bearish continuation is expected, potentially targeting the crucial $2.8K support range.
Onchain Analysis
By Shayan
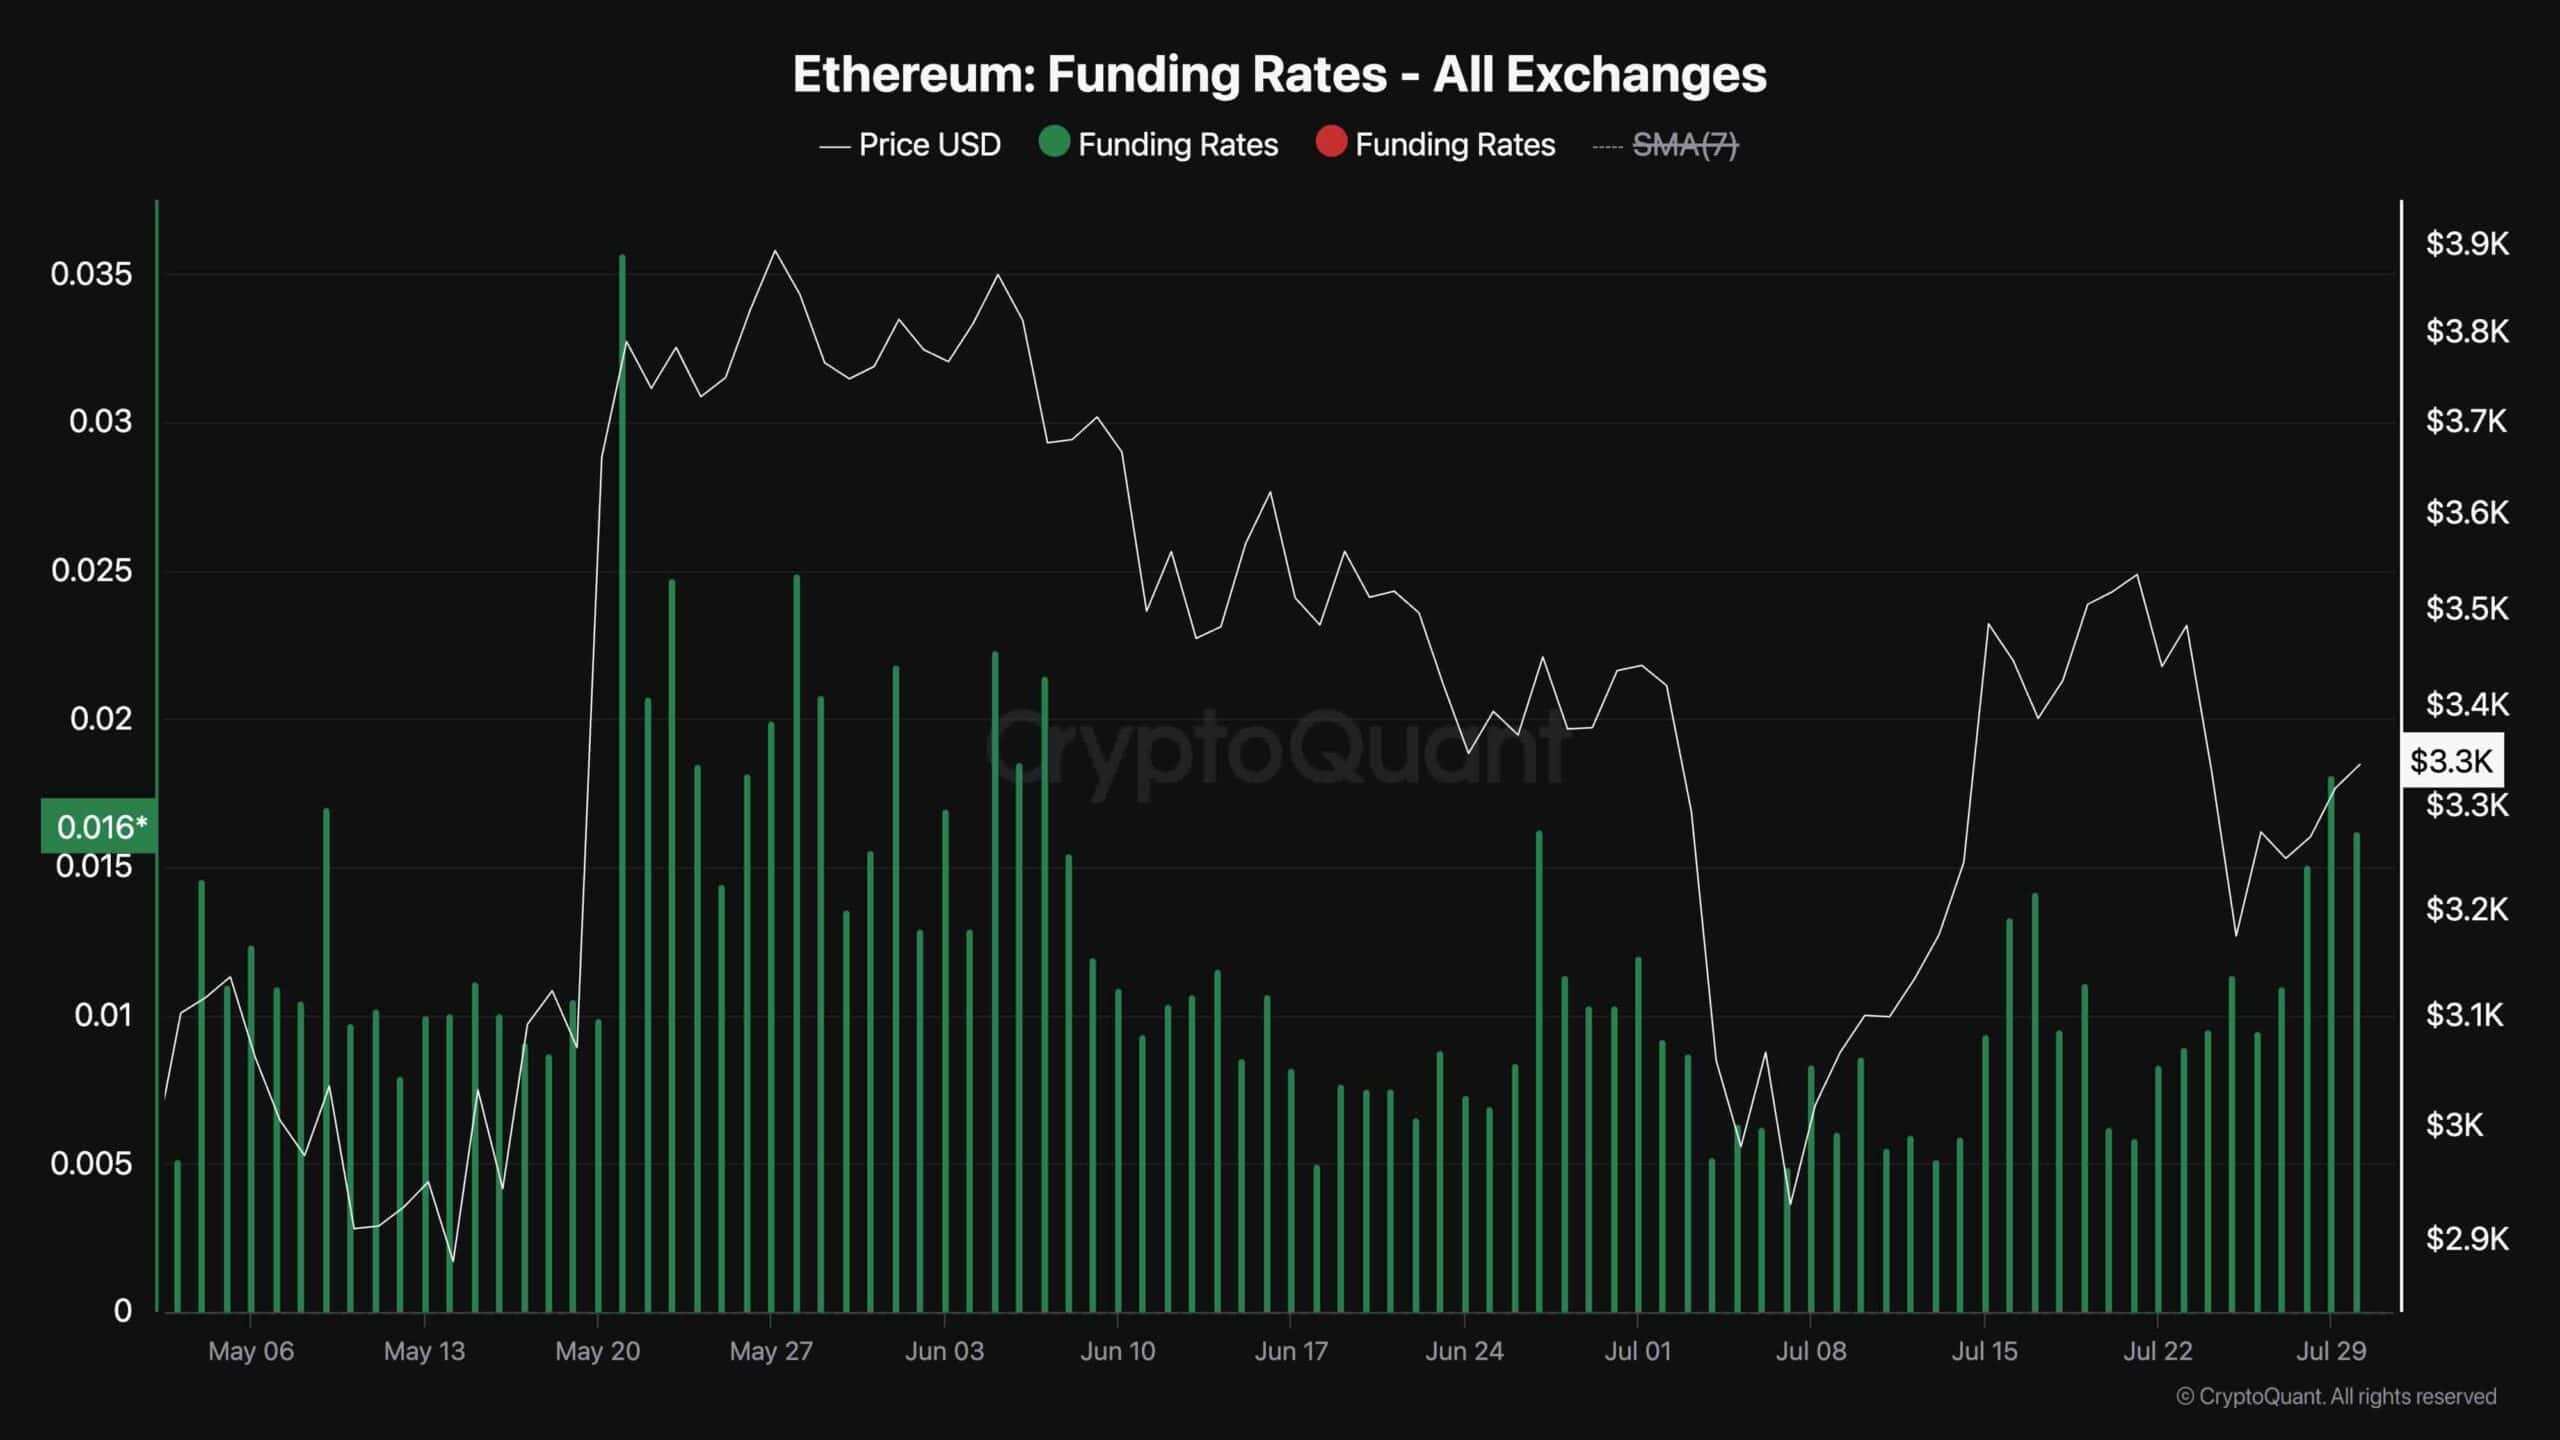
While Ethereum’s price has been trending downward after failing to break above the $3.5K level and rally toward its all-time high, it is insightful to assess the futures market sentiment.
The accompanying chart presents the Ethereum funding rate metric, which indicates whether buyers or sellers are more aggressively executing their orders. Positive funding rates signify bullish sentiment, while negative funding rates reflect bearish sentiment.
As the chart demonstrates, the funding rates have been gradually increasing since the initial price rejection at the $3.5K level. The current funding rate values suggest that the futures market is no longer overheated, implying that the price could potentially begin another sustainable rally if demand returns to the market.
In summary, the funding rate metric indicates a shift towards a more balanced market sentiment. This shift, combined with potential renewed demand, could pave the way for Ethereum to embark on a new upward trajectory, aiming to break through previous resistance levels and possibly set the stage for a rally toward its all-time high.