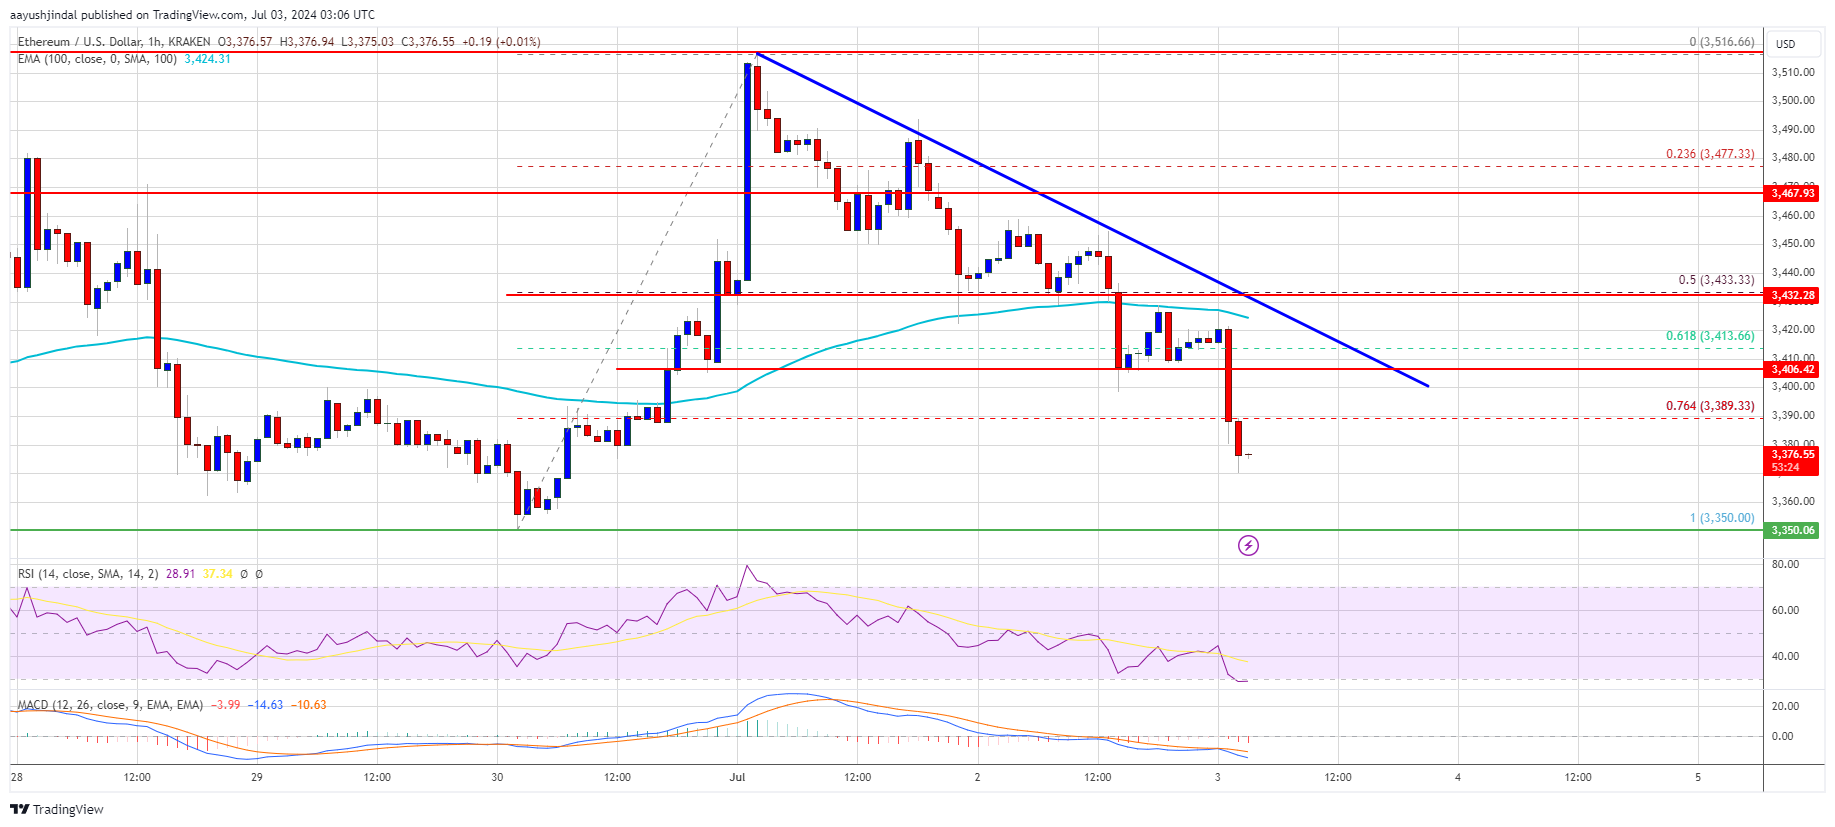
Ethereum price failed to climb above the $3,520 zone and corrected its gains, now showing bearish signs below the $3,400 support zone.
Ethereum began a downward correction after failing to surpass the $3,520 zone.
The price is trading below $3,400 and the 100-hour Simple Moving Average.
A key bearish trend line is forming with resistance near $3,410 on the hourly chart of ETH/USD (data feed via Kraken).
The pair now risks further downsides below the $3,350 support zone.
Ethereum Price Dips Again
Ethereum’s price couldn’t sustain above the $3,520 and $3,550 resistance levels, forming a top near $3,520 before starting a fresh decline similar to Bitcoin. The price dropped below the $3,450 and $3,420 support levels.
Bears pushed the price below the 50% Fib retracement level of the upward wave from the $3,351 swing low to the $3,516 high, suggesting the price might continue to decline below the $3,350 support zone.
Ethereum is trading below $3,400 and the 100-hour Simple Moving Average, as well as below the 76.4% Fib retracement level of the upward wave from the $3,351 swing low to the $3,516 high.
If a recovery wave occurs, the price might face resistance near the $3,400 level, with a key bearish trend line forming resistance near $3,410 on the hourly chart of ETH/USD. The first major resistance is near the $3,435 level.


