


Bitcoin’s price began a steady climb, surpassing the $62,500 resistance level, but it is currently facing challenges around the $64,500 and $65,000 resistance zones.
The cryptocurrency is demonstrating positive momentum but encountering resistance near the $64,500 mark.
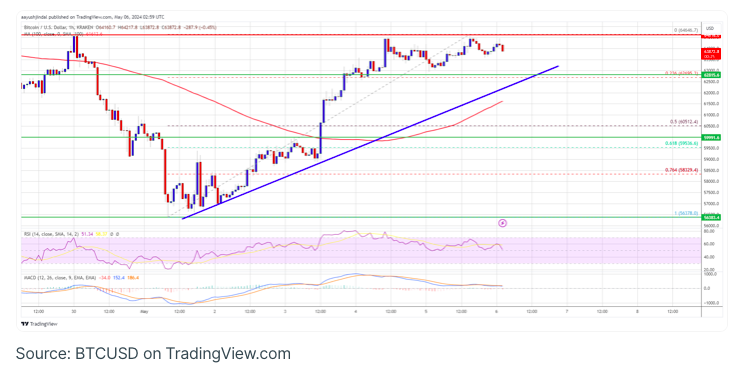
Bitcoin’s price is currently trading above $62,500 and the 100-hour Simple Moving Average.
An important bullish trend line is forming, providing support at around $62,800 on the hourly chart for the BTC/USD pair (data sourced from Kraken).
Despite the recent upward movement, the pair might find it difficult to break through the $64,500 and $65,000 resistance levels.
Bitcoin Price Encounters Resistance Barriers
Bitcoin found support around the $56,500 zone and initiated a solid upward movement, breaking through the $60,000 and $61,200 resistance levels.
Bulls drove the price above $63,500 and past the 100-hourly Simple Moving Average. However, bears have become active again near the $64,500 and $65,000 resistance zones. A recent high was recorded at $64,646, and now Bitcoin’s price is consolidating its gains.
It remains above the 23.6% Fibonacci retracement level of the rise from the $56,378 swing low to the $64,646 high. Additionally, there’s a key bullish trend line forming with support at $62,800 on the hourly chart for the BTC/USD pair.
Currently, Bitcoin is trading above $62,500 and the 100-hourly Simple Moving Average. The nearest resistance is at $64,500, with the first major hurdle around $65,000. The next significant resistance could be at $65,500.
A decisive break above the $65,500 resistance could propel Bitcoin’s price higher. The following resistance level is at $66,800. If there’s a clear move past this zone, the price could continue its upward trajectory. If that happens, it might climb towards the $68,000 mark.
Is BTC Headed for Another Dip?
If Bitcoin can’t break through the $64,500 resistance zone, it might be at risk of another drop. The first line of support on the downside is around $62,800, coinciding with the trend line.
The key support level after that is $61,500. If Bitcoin closes below this level, it could head toward the 61.8% Fibonacci retracement level of the upward movement from the $56,378 low to the $64,646 high, which sits at $59,500. Further declines could push the price down to the $58,000 support zone in the near term.
Technical indicators:
- Hourly MACD: The MACD is losing momentum in the bullish zone.
- Hourly RSI (Relative Strength Index): The RSI for BTC/USD is hovering near the 50 level.
Critical Support Levels: $62,500, followed by $61,500.
Major Resistance Levels: $64,500, $65,000, and $65,500.