


Dogecoin is up over 25% against the US Dollar. DOGE cleared the $0.120 resistance and might continue to rise toward the $0.132 resistance.
- DOGE started a strong increase after it broke the $0.0850 resistance against the US dollar.
- The price is trading above the $0.120 level and the 100 simple moving average (4 hours).
- There was a break above a key contracting triangle with resistance at $0.0845 on the 4-hour chart of the DOGE/USD pair (data source from Kraken).
- The price could extend its rally above the $0.1280 and $0.130 resistance levels.
The price of Dogecoin experiences a surge, surpassing the $0.12 mark.
In recent sessions, Dogecoin’s value initiated a robust uptrend starting from the $0.080 support zone. Overcoming several obstacles around $0.0850, DOGE entered a favorable territory.
On the 4-hour chart of the DOGE/USD pair, a significant breakout occurred above a crucial contracting triangle with resistance at $0.0845. Subsequently, it breached the $0.100 resistance, aligning itself with the positive trends seen in Bitcoin and Ethereum.
With a surge of over 25%, Dogecoin is currently trading above $0.120, marking a new multi-week high around $0.1282. Although the price is undergoing a corrective phase, it remains comfortably above the 23.6% Fibonacci retracement level of the recent upswing from the $0.0845 swing low to the $0.1282 high.
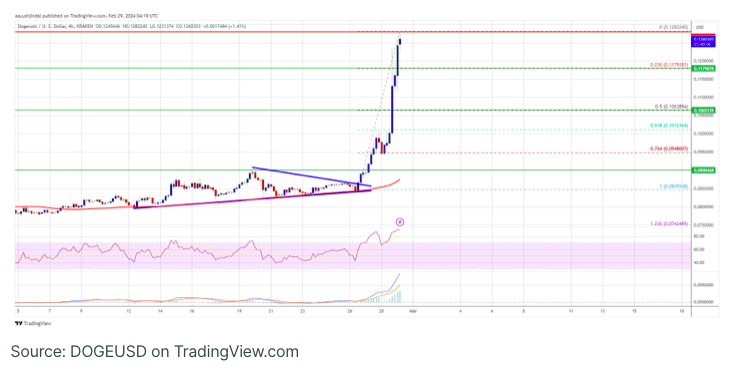
DOGE is currently above the $0.1220 level and the 100 simple moving average (4 hours). Moving upwards, it encounters resistance around the $0.1280 level, with the subsequent significant hurdle positioned at $0.1320. A successful breach above $0.1320 could propel the price towards the $0.1450 resistance, followed by a substantial resistance near $0.150. Further gains might lead the price to test the $0.1620 level.
Is DOGE Facing a Downward Correction?
If DOGE struggles to advance beyond the $0.1280 level, there is a possibility of initiating a downside correction. Initial support on the downside is anticipated around the $0.120 level.
The subsequent significant support is positioned near the $0.1065 level or the 50% Fibonacci retracement level, derived from the recent surge spanning from the $0.0845 swing low to the $0.1282 high. A breach below the $0.1065 support could lead to further declines, potentially approaching the $0.100 level.
As for technical indicators, the 4 Hours MACD shows increasing bullish momentum, while the 4 Hours RSI (Relative Strength Index) is currently in the overbought zone.
Key Support Levels are at $0.120, $0.1065, and $0.10.
Key Resistance Levels include $0.1280, $0.1320, and $0.150.