


Ethereum’s price demonstrates optimistic indications, maintaining levels above the $2,850 support. ETH is poised for further advancement, potentially surging towards the resistance zone at $3,000.
The ascent of Ethereum is gradual, surpassing the $2,800 support region.
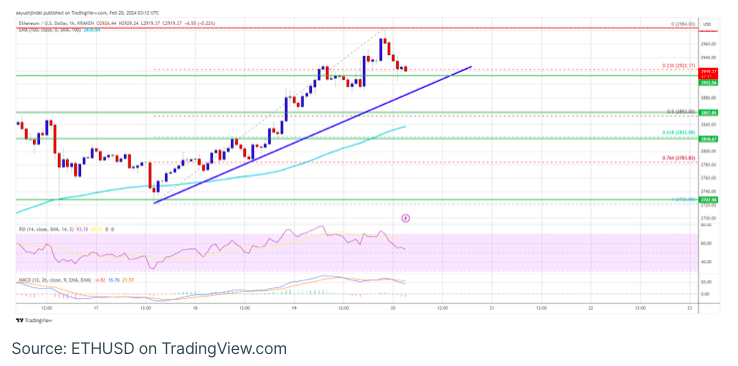
The current price is above $2,850, and it maintains position above the 100-hourly Simple Moving Average.
A significant bullish trend line is taking shape with support at $2,910 on the hourly chart of ETH/USD, based on data from Kraken.
The currency pair may sustain its upward trajectory towards the resistance zone at $3,000.
Ethereum’s Price Continues to Find Support.
Ethereum’s price sustained a strong demand, gradually climbing beyond the $2,850 mark. ETH successfully surpassed the $2,920 resistance, showcasing a superior performance compared to Bitcoin.
Despite this, the crucial $3,000 resistance zone was not tested. The latest multi-week high was established around $2,984, and the price is presently consolidating its gains. Ether remains steady in proximity to the 23.6% Fibonacci retracement level, calculated from the recent surge spanning from the $2,723 swing low to the $2,984 high.
On the hourly chart of ETH/USD, a significant bullish trend line is taking shape, with support positioned at $2,910. Ethereum continues to trade above $2,850 and the 100-hourly Simple Moving Average.
Immediate upside resistance is anticipated around the $2,940 level, followed by a more substantial hurdle at $2,985. The subsequent major resistance is situated near $3,000, and a successful breach might propel the price to test the $3,050 resistance zone.
Should the bulls successfully drive the price beyond the $3,050 resistance, Ethereum may experience a surge towards the $3,120 resistance. In such a scenario, there is potential for the price to ascend further towards the $3,250 level in the short term. Subsequent gains could even prompt a test of the $3,350 threshold.
Is Ethereum Vulnerable to a Downside Correction?
If Ethereum is unable to surpass the $2,940 resistance, it may initiate a downside correction. Initial support on the downside is anticipated around the $2,910 level and within the trend line zone.
The subsequent critical support could be the $2,850 zone or the 50% Fibonacci retracement level, calculated from the recent wave extending from the $2,723 swing low to the $2,984 high. A clear breach below the $2,850 support level could lead the price towards $2,840 or the 100-hourly Simple Moving Average, with the primary support resting at $2,780. Further losses might propel the price towards the $2,720 level in the upcoming sessions.
Analyzing the technical indicators:
- The hourly MACD for ETH/USD is currently gaining momentum in the bullish zone.
- The hourly RSI for ETH/USD is positioned above the 50 level.
Key Support Level:
- $2,850
Key Resistance Level:
- $2,940