


Bitcoin is making a new push to surpass the $52,000 resistance, aiming to breach the crucial $52,800 resistance for sustained upward momentum. The current trading scenario sees Bitcoin above $52,000 and the 100 hourly Simple Moving Average. Notably, there was a notable breakthrough above a significant bearish trend line with resistance at $51,880 on the hourly chart of the BTC/USD pair, sourced from Kraken data. Further upward movement for the pair is contingent on successfully surpassing the $52,800 resistance zone.
Bitcoin is poised for additional gains in its price.
The Bitcoin price initiated a corrective decline from the resistance zone at $52,800, slipping below levels at $52,000 and $51,500. Despite this downturn, bullish activity prevailed above the $50,500 region, leading to the formation of a low around $50,581. Presently, there is an endeavor for an upward movement, evidenced by a breakthrough above the $51,200 and $51,500 resistance marks. Additionally, the price successfully surpassed the 50% Fibonacci retracement level of the decline from the $52,843 high to the $50,581 low.
Notably, a pivotal development occurred with the breach of a significant bearish trend line marked by resistance at $51,880 on the BTC/USD pair’s hourly chart. As a result, Bitcoin is currently trading above $52,000 and the 100-hourly Simple Moving Average.
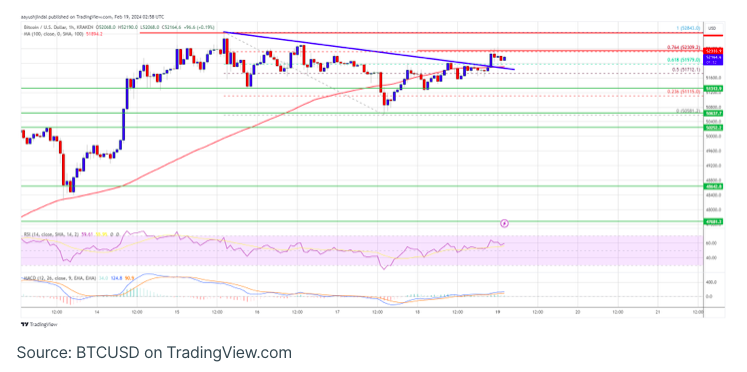
The immediate hurdle lies in the vicinity of the $52,300 level, closely aligned with the 76.4% Fibonacci retracement level derived from the descent between the $52,843 peak and the $50,581 trough. Should the price surpass this level, the subsequent noteworthy resistance is anticipated at $52,800, paving the way for a potential extension of the upward momentum. Subsequently, the bulls may target $53,200 as the next significant milestone. A decisive breach above the $53,200 resistance could propel the price toward the $54,000 level, with the subsequent hurdle lying near $55,000.
Another Decline In BTC?
Should Bitcoin be unable to surmount the resistance at $52,300, a potential downturn may ensue in the near future. Immediate support on the downside is situated around the $51,850 level and is reinforced by the presence of a trend line.
The initial significant support level stands at $51,300. A conclusive breach below this level could trigger bearish momentum, potentially leading the price towards the support zone at $50,500.
Analyzing technical indicators:
- Hourly MACD: The MACD is currently gaining momentum within the bullish zone.
- Hourly RSI (Relative Strength Index): The RSI for BTC/USD is presently positioned above the 50 level.
Key support levels to monitor include $51,850, followed by $51,300. Conversely, pivotal resistance levels to watch are $52,300, $52,800, and $54,000.