


The Bitcoin price is in a consolidation phase above the crucial $42,500 support region. A potential bullish surge may occur if the resistance barrier at $43,500 is successfully surpassed.
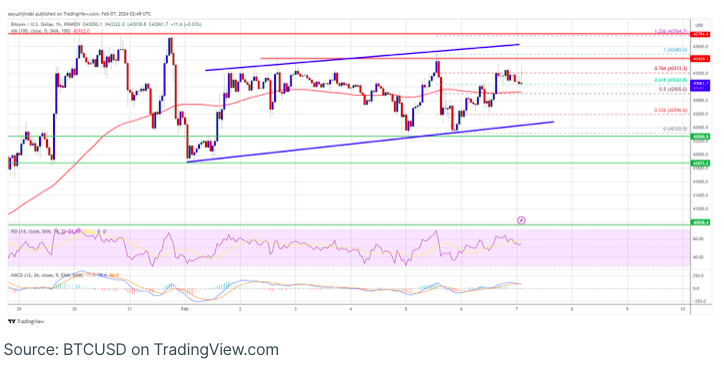
Despite trading above $42,500 and the 100-hourly Simple Moving Average, Bitcoin is encountering resistance at levels around $43,400 and $43,500. The hourly chart of the BTC/USD pair (data feed from Kraken) reveals the formation of a significant rising channel, indicating support at $42,450.
For a substantial upward movement, Bitcoin needs to overcome the resistance zone at $43,500, which could potentially trigger a robust increase in the price.
Bitcoin Price Targets Upside Movement
Bitcoin’s price established a foundation above the $41,800 mark, initiating a consistent uptrend. Successfully surpassing the resistance at $42,200 and $42,500, BTC also reclaimed the 100-hourly Simple Moving Average.
Furthermore, the price ascended beyond the 50% Fibonacci retracement level of the downward movement from the $43,488 swing high to the $42,320 low. The bullish momentum even propelled the price above the $43,000 threshold.
Nevertheless, bearish activity is observed around the $43,200 level, which aligns with the 76.4% Fibonacci retracement level of the downward movement from the $43,488 swing high to the $42,320 low.
Currently trading above $42,650 and the 100-hourly Simple Moving Average, Bitcoin faces immediate resistance at the $43,200 level. The subsequent significant resistance lies at $43,500, surpassing which could trigger a substantial uptick in price. The bulls’ target might extend to $44,200.
A decisive breakthrough beyond the $44,200 resistance has the potential to propel the price towards the $45,000 resistance. The subsequent resistance is currently emerging around the $45,500 level. Surpassing and closing above the $45,500 threshold may lead to further upward momentum. The subsequent notable resistance is positioned at $46,500.
Is BTC Poised for Yet Another Downturn?
Should Bitcoin face challenges in surpassing the $43,500 resistance zone, it may trigger a potential descent. Immediate support on the downside is anticipated around the $42,900 level and the 100-hourly SMA.
The initial significant support rests at $42,450, aligned with the channel trend line. A conclusive breach below $42,450 could instigate bearish momentum, potentially leading the price towards the $41,800 support.
As for technical indicators, the hourly MACD is currently decelerating within the bullish zone. Meanwhile, the hourly RSI (Relative Strength Index) for BTC/USD is presently above the 50 level.
Key Levels:
- Major Support Levels: $42,900, followed by $42,450.
- Major Resistance Levels: $43,200, $43,400, and $43,500.