


Currently hovering around the $0.70 mark, XRP’s daily chart movements are telling a story that investors are eagerly following. The burning question is whether the $0.70 mark signifies the commencement of a bullish trend for XRP, or is it merely a transient peak?
A close examination of the daily Binance chart for XRP/USDT reveals a significant surge as XRP approaches a crucial resistance level at $0.70. This price isn’t just a numerical value; it represents a battleground where bulls and bears have previously clashed, and the outcome holds the potential to shape the prevailing market sentiment for XRP.
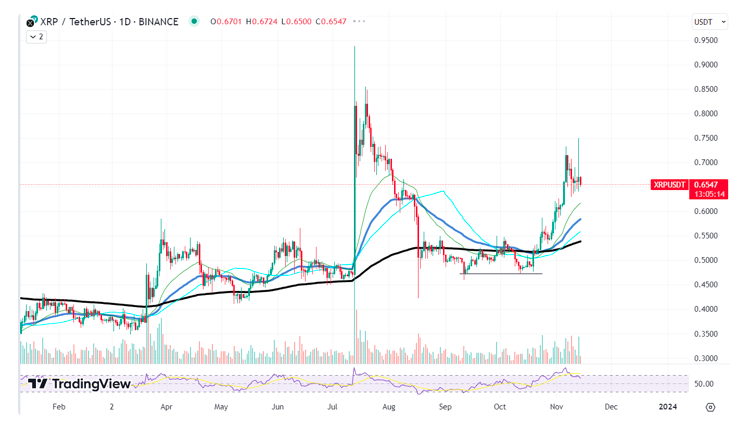
The technical indicators are unveiling crucial insights. Recent price action has positioned XRP above both the 50-day and 100-day moving averages, signaling a bullish trend continuation. The upward angle of the moving averages suggests a consistent bullish momentum supporting the current price.
Furthermore, the Relative Strength Index (RSI) hovers around the mid-range, indicating a balance between overbought and oversold conditions. This suggests that there is potential for further upward movement before reaching overbought territory, providing a relatively comfortable margin for XRP to approach the $0.70 resistance without immediate pressure for a technical correction.
However, the cryptocurrency markets are known for their volatility. Sustaining a rally beyond $0.70 for XRP necessitates a steady influx of buying pressure. A confident close above this level could pave the way for an extended rally, potentially testing resistance levels at approximately $0.75 or higher.
On the flip side, if XRP fails to establish firm ground above $0.70, a pullback may occur as short-term traders take profits. This could lead to a retest of support levels, possibly around $0.65, where consolidation might occur before another attempt at an upward move.
Solana Poised for a New Rally
Solana (SOL) has recently surpassed the $54 threshold, a price not witnessed since May 2022. Examining the daily charts for SOL/USD on KuCoin reveals a robust uptrend, sparking curiosity among investors and traders about the sustainability of this momentum in the unpredictable cryptocurrency market.
The chart highlights Solana’s price riding a vigorous wave of buying activity, with its position above both the 50-day and 100-day moving averages indicating a robust bullish trend. The upward trajectory of the moving averages reflects consistent buying interest over time, and the accompanying surge in volume substantiates the strength of the ongoing price movement.
In the first scenario, should Solana continue its upward path above these moving averages while witnessing an escalation in buying volume, there is potential for the price to target the next psychological resistance around the $60 mark. This would signify an approximately 12% increase from its current level, presenting a plausible short-term objective for the cryptocurrency.
The second scenario considers the prospect of a pullback. Despite the Relative Strength Index (RSI) being high but not yet in overbought territory, suggesting room for growth, a retest of the $54 level, now functioning as support, could occur before any further upward movement. If this support holds, it might enhance investor confidence, serving as a platform for another upward surge.
A noteworthy aspect is the pattern of higher highs and higher lows on the chart, typically indicative of a continuation of the uptrend. Additionally, Solana’s fundamental strengths, including its high-speed blockchain capabilities and increasing adoption in decentralized finance (DeFi) and non-fungible tokens (NFTs), provide a solid foundation for its current price dynamics.