

 Nears a Significant Breakthrough with an Unexpected Surge.")
In a persistently volatile cryptocurrency market, marked by price fluctuations influenced by various factors, the meme coin Shiba Inu (SHIB) has managed to breach a local resistance level, setting the stage for a possible long-term reversal. A meticulous analysis of its recent chart reveals intriguing patterns that suggest a potential upturn in its price trajectory.
Primarily, a detailed examination of the SHIB/USDT chart underscores a coin engaged in a formidable struggle with the 21-day Exponential Moving Average (EMA). Throughout the history of many cryptocurrencies, the 21-day EMA has consistently served as a pivotal indicator of bullish or bearish momentum.
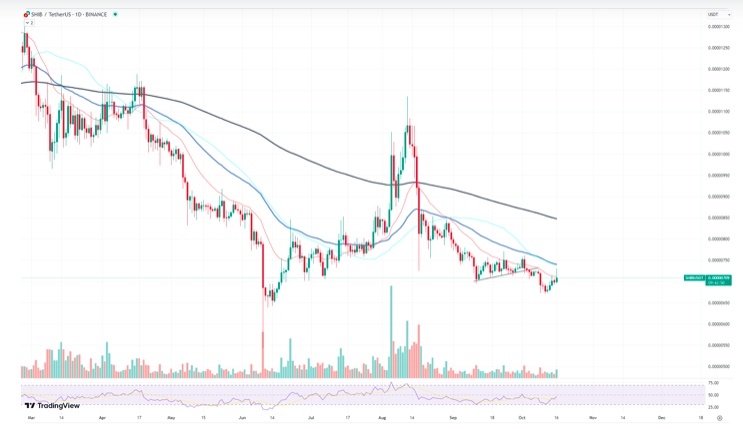
Currently, SHIB appears to be in the process of testing this pivotal resistance level, reflecting an ongoing tug-of-war between bears striving to drive the price downward and bulls pushing for an upward surge. Should SHIB successfully conclude above this level, traders may anticipate a resurgence in bullish momentum.
Nevertheless, amid the apparent optimism displayed on the chart, it is imperative not to disregard certain underlying factors. Among the most conspicuous elements is the declining trading volume. In an ideal scenario, a price chart depicting a cryptocurrency contending with a critical resistance, such as the 21-day EMA, should be accompanied by an increase in trading volumes.
This rise in trading volumes typically signifies robust buying interest and lends credibility to the price movement. However, in SHIB’s case, the diminishing volume tells a different story, raising concerns about the sustainability of any bullish upswing. A surge without substantial volume support could potentially be short-lived.
Ethereum Stages a Comeback
The Ethereum (ETH) price chart unveils a complex narrative of challenges and aspirations. As the second-largest cryptocurrency by market capitalization, Ethereum’s price trajectory commands considerable attention from traders and investors alike. A thorough examination of the recent chart suggests that Ethereum is once more testing the $1,600 mark. The critical question is whether it can sustainably break through this barrier.
Ethereum seems to be navigating turbulent waters. Over the past few weeks, a noticeable downtrend has prevailed. Price movements have been confined below a descending resistance line, characterized by a succession of lower highs and lower lows. This paints a somewhat bearish picture, indicating persistent selling pressure at higher price levels.
Nonetheless, Ethereum enthusiasts need not lose all hope. The cryptocurrency is currently in the vicinity of the $1,600 threshold, a level that has historically held significance as both support and resistance. If Ethereum can secure a close above this level and maintain its position, it might serve as an early sign of a potential trend reversal. A sustained breach of this critical threshold could stimulate increased buying interest, potentially propelling ETH to loftier heights.
Will Solana Recreate the Growth It Experienced in September?
Solana’s (SOL) journey in the cryptocurrency market has been undeniably remarkable, grabbing the attention of traders and investors worldwide with its meteoric ascent. As the recent charts suggest the possibility of a rebound, the question naturally arises: can Solana replicate the growth it experienced in September?
Upon scrutinizing the provided SOL/USDT chart, it’s evident that an emerging uptrend is in progress. The price seems to be receiving support from an ascending trendline, signaling increasing buyer confidence. Interestingly, this present uptrend shares similarities with the initial stages of Solana’s remarkable surge in June. During that period, Solana’s price steadily gathered momentum before skyrocketing in September, achieving record highs and establishing itself as one of the premier cryptocurrencies.
Nonetheless, while the current chart displays encouraging signs, it’s important to acknowledge the disparities between these two timeframes. The extraordinary growth observed in September was driven by a combination of fundamental and technical factors. The introduction of various decentralized applications (dApps) on the Solana network, coupled with expanding adoption, served as substantial catalysts. It represented a unique convergence of demand, technology, and market sentiment that propelled Solana into the limelight.
In contrast, the present situation is characterized by industry-wide caution, as many cryptocurrencies strive to recover their former positions following substantial corrections. Although Solana’s recent movements suggest the potential for a bullish phase, the scale and pace of its ascent may not precisely mirror that of the September surge.