


The Bitcoin price is encountering difficulties in surpassing the $27,500 resistance level. As a result, BTC is gradually descending and could potentially revisit the support zone around $26,200 in the upcoming sessions.
Bitcoin is persistently grappling with the $27,500 resistance barrier.
Currently, the price is trading above $26,800 and is above the 100-hourly Simple Moving Average.
On the BTC/USD hourly chart (data sourced from Kraken), a significant bullish trend line is emerging, offering support in the vicinity of $26,810.
If Bitcoin continues to face challenges below the $27,500 mark, there is a possibility that it could initiate a bearish trend below $26,800.
Bitcoin’s Price Encounters Rejection.
Bitcoin’s price made several attempts to gather momentum for a breakthrough above the $27,500 resistance zone. Regrettably, BTC couldn’t sustain its upward trajectory and gradually shifted lower following the Federal Reserve’s interest rate decision.
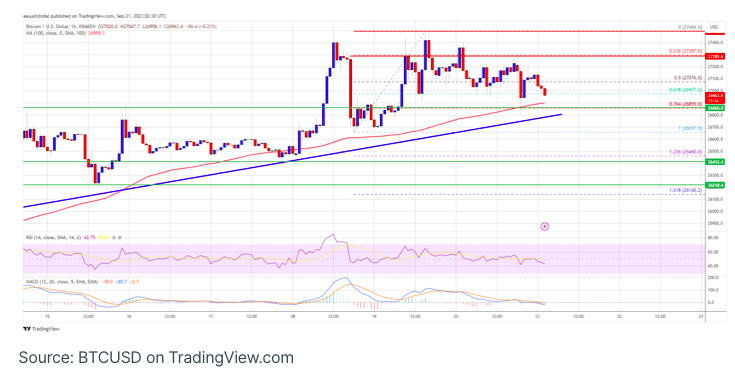
The Federal Reserve opted to maintain interest rates at a steady 5.5%, and this had a minimal impact on Bitcoin. Presently, the price is in descent, trading below the $27,200 threshold. Notably, it breached the 50% Fibonacci retracement level of the upward movement from the $26,656 low to the $27,495 high.
Bitcoin is currently trading above $26,800 and remains above the 100-hourly Simple Moving Average. Additionally, an essential bullish trend line is forming, offering support around $26,810 on the BTC/USD hourly chart.
Should the price manage to remain stable above this trend line, there is potential for an upward resurgence. Immediate resistance on the upside is situated around the $27,280 level, with the primary resistance zone at $27,500. A breakthrough above this level could instigate bullish momentum.
The subsequent significant resistance level to watch is likely to emerge around $28,200. If the price successfully breaches this $28,200 resistance, it could set the stage for an advance toward the $29,500 resistance. Further gains might even signal a potential move toward the $30,000 mark in the days ahead.
Is BTC Primed for a Downside Break?
If Bitcoin fails to initiate a fresh uptrend surpassing the $27,280 resistance, a continuation of the downward movement is conceivable. Immediate support to the downside resides near the $26,855 level, or at the 76.4% Fibonacci retracement level derived from the upward swing between the $26,656 low and the $27,495 high.
The subsequent significant support zone can be found around the $26,800 level in conjunction with the established trend line. A breakdown below and subsequent closure beneath the $26,800 level may trigger further bearish developments, potentially leading the price towards the subsequent support at $26,200.
Technical indicators:
- Hourly MACD: The MACD is currently decelerating within the bullish region.
- Hourly RSI (Relative Strength Index): The RSI for BTC/USD has dipped below the 50 level.
Key Support Levels: $26,800, followed by $26,200.
Key Resistance Levels: $27,280, $27,500, and $28,200.