

 Conceals a Cryptic Price Signal")
Ethereum’s recent price behavior has been akin to an intricate dance, and if you’re not paying close attention, you might miss its subtle rhythm. What deserves the spotlight here is an often-overlooked yet influential indicator: the RSI divergence. The Relative Strength Index (RSI) provides insights into the pace of price movements, and at this moment, it’s conveying a message worth heeding.
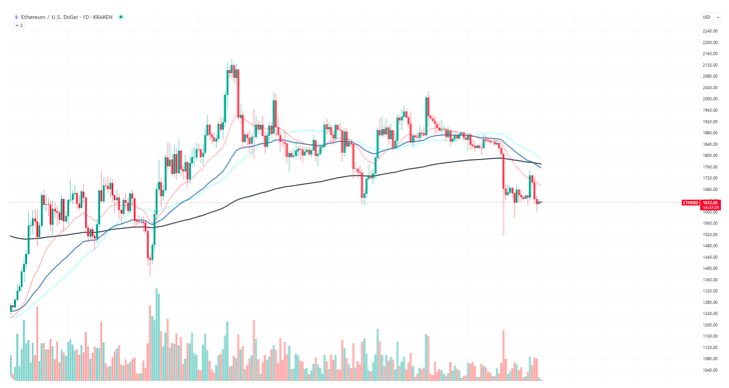
Now, let’s delve into the details. Ethereum is currently trading at approximately $1,631.95, which is respectable. However, the intriguing part lies in the RSI’s trajectory. While Ethereum’s price seems to be descending rapidly, the RSI is steadily ascending, creating a scenario where they appear to be on divergent paths, like two individuals waving at each other from opposite directions. This divergence pattern is a classic indicator of a potential reversal. If this pattern materializes, Ethereum could be on the verge of a turnaround towards its next resistance level.
However, investors should exercise caution. Although the RSI divergence is a compelling indicator, it should not be regarded as an absolute certainty. While the RSI offers an encouraging signal, maintaining a grounded perspective and exercising prudence remains a wise approach.
XRP takes another chance
Just when it appears to be on the ropes, XRP springs back to life. Despite its recent dip below the 200 EMA, XRP is displaying signs of vitality. According to the most recent data, it’s currently trading at around $0.50, a modest yet noteworthy uptick.
Now, let’s provide some context. Recall the SEC v. Ripple legal battle? XRP enjoyed a moment of triumph when the case swung in its favor. However, fast-forward to today, and it seems as though that victory has been wiped away. The asset has surrendered all its gains, painting a rather bleak picture for both itself and the market. But here’s the twist: XRP isn’t throwing in the towel.
The current price level may not make headlines, but it’s a starting point. It’s as if XRP is mustering its strength, eyeing the resistance level as though it’s the final boss in a video game. In a market that has been less than forgiving, even a small victory holds significance.
So, what’s the key takeaway here? XRP undoubtedly finds itself in a challenging position. However, it’s also exhibiting a brand of resilience that demands recognition. It’s almost as if the asset is whispering, “Hey, I’m still here, and I’m here to stay.” Whether this marks the inception of a substantial rally or merely a brief respite remains uncertain.
Shiba Inu’s Future Cast Into Doubt
Shiba Inu (SHIB) resembles an enigmatic character in a suspenseful novel—just when you think you’ve deciphered its intentions, it throws a curveball. Case in point: the recent debunking of its symmetrical triangle pattern. For those diligently tracking SHIB, this pattern served as a roadmap, providing guidance on the asset’s potential direction. However, it now feels like someone has torn that page out of the book. As per the latest data, SHIB is currently trading at approximately $0.00000779.
Yet, let’s not become entangled in the labyrinth. The pattern’s invalidation isn’t the conclusion of the narrative; rather, it’s akin to a plot twist. Beneath the seemingly stagnant price, there’s a palpable pulse. The Shiba Inu network’s burn rate has surged by an astonishing 500%. This isn’t just a statistic; it’s a heartbeat, a signal of increasing network activity.
Now, let’s layer on another facet of this storyline. The cryptocurrency market is an unpredictable realm, influenced by an array of factors, from global events to investor sentiment. In this volatile landscape, the invalidated pattern could either serve as a stumbling block or a stepping stone for SHIB. It’s as if the asset stands at a crossroads, and the direction it chooses remains uncertain, open to interpretation.