After a sharp 11% decline in Bitcoin’s value, currently at $26,105, trader sentiment has shifted to bearish. Despite finding some support around the $25,000 mark, numerous analysts are anticipating a further downward move, potentially targeting the significant $20,000 level.
The downward trend isn’t confined solely to the cryptocurrency markets; the United States equities markets also experienced a week of losses. The S&P 500 Index registered a 2.1% decrease, and the Nasdaq Composite saw a drop of approximately 2.6%. Both indexes are now on a three-week losing streak, indicating that traders are adopting a risk-off approach in the short term.
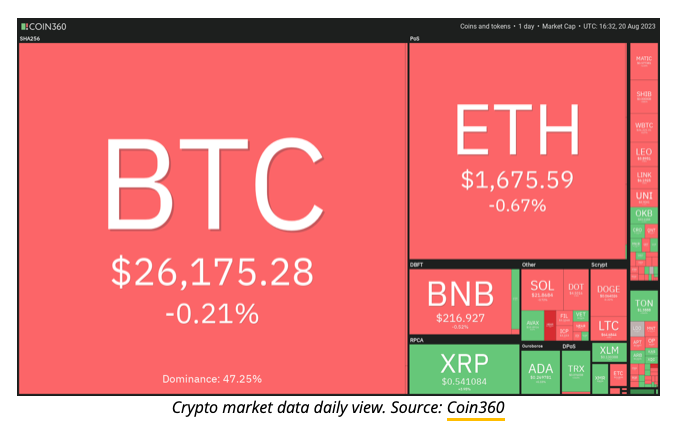
The decline in Bitcoin’s value had a cascading effect on various altcoins, signaling a widespread selling trend. Nonetheless, amid this widespread decrease, a handful of altcoins have managed to distinguish themselves. They’ve either rebounded from robust support levels or maintained their upward momentum.
Now, let’s examine the charts of the leading five cryptocurrencies that might defy the prevailing bearish sentiment and maintain a positive trajectory in the coming days.
Bitcoin price analysis
Over the recent days, Bitcoin’s price has been confined within a range spanning from $24,800 to $31,000. Following unsuccessful attempts to maintain levels beyond the resistance, the price has now retraced to approach the lower end of this established range.
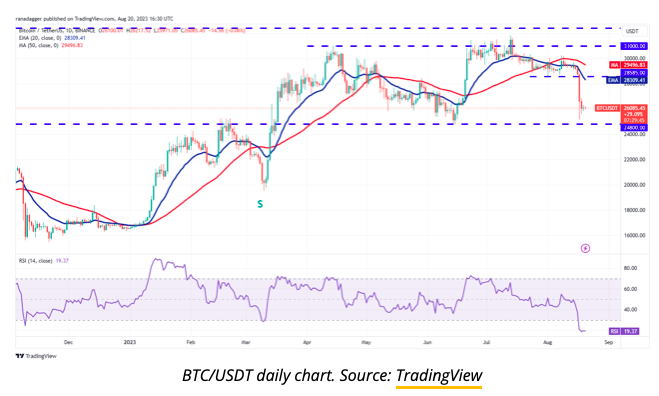
The recent decline over the past few days has driven the relative strength index (RSI) into oversold territory, suggesting a potential recovery on the horizon. Should the price rebound from its current position, it could aim for the 20-day exponential moving average ($28,309). However, rallies toward this level are likely to be met with selling pressure from bears.
Should the price reverse course after reaching the 20-day EMA, there’s a possibility that the BTC/USDT pair might once again retreat to its critical support at $24,800. A breach of this support level could pave the way for a downward move toward $20,000.
On a positive note, a breakout and successful close above the 20-day EMA could signal an extension of the pair’s consolidation within the existing range for a few more days. For the bulls to initiate a fresh upward momentum, they would need to propel and maintain the price above $31,000. However, this scenario seems somewhat unlikely in the current circumstances.
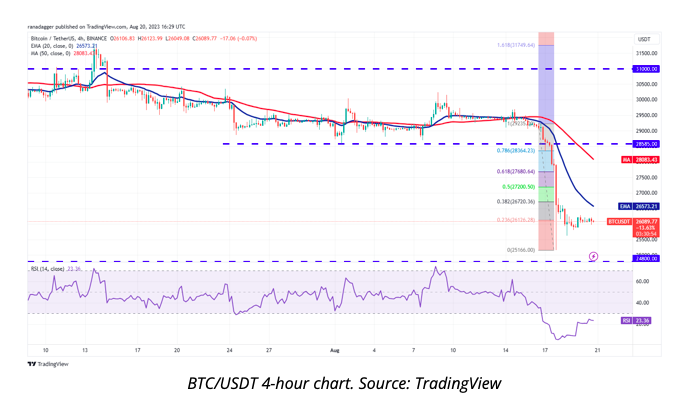
The four-hour chart displays a downward slope for both moving averages, coupled with the relative strength index (RSI) dwelling in the oversold region. This alignment suggests that the prevailing control is in the hands of the bears. Should the price shift its course after encountering resistance at the 20-day EMA, there’s a possibility of the currency pair revisiting the support zone spanning from $25,166 to $24,800.
Conversely, a breakthrough and successful close beyond the 20-day EMA might signify a weakening bearish influence. This could potentially initiate a rally towards the 50% Fibonacci retracement level at $27,200, followed by the 61.8% retracement level at $27,680.
Analysis of Hedera Price
Hedera (HBAR) experienced a decline from the upper resistance level at $0.078 on August 15th, currently trading at $0.06. This downturn suggests bearish activity at elevated levels. Nonetheless, a slight advantage for the bulls lies in the fact that buyers intervened when the price dipped to the 50-day SMA ($0.054).
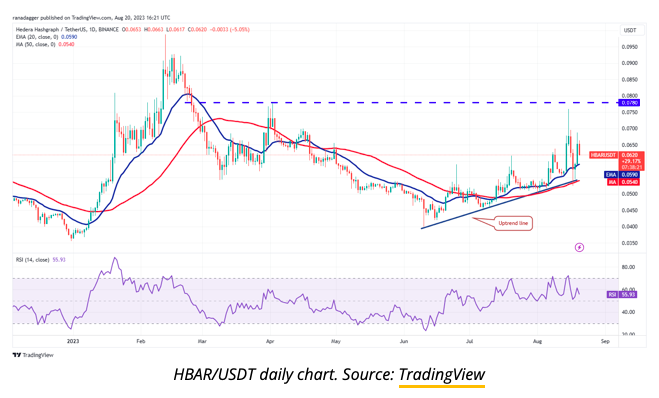
Both moving averages are displaying upward slopes, and the RSI remains within the positive range. These indications highlight the prevailing advantage of the buyers. The upcoming move for the HBAR/USDT pair will likely involve the bulls attempting to propel the price towards the overhead resistance at $0.078. Should this resistance be surpassed, there’s potential for the pair to advance to $0.093, and eventually, $0.099.
Conversely, if the price reverses and falls below the 20-day EMA, it would signify that bears are persistently selling during rallies. This could lead to a scenario where the pair revisits the support located at the uptrend line. A breach beneath this level might open the path for a descent towards $0.045 and subsequently $0.040.
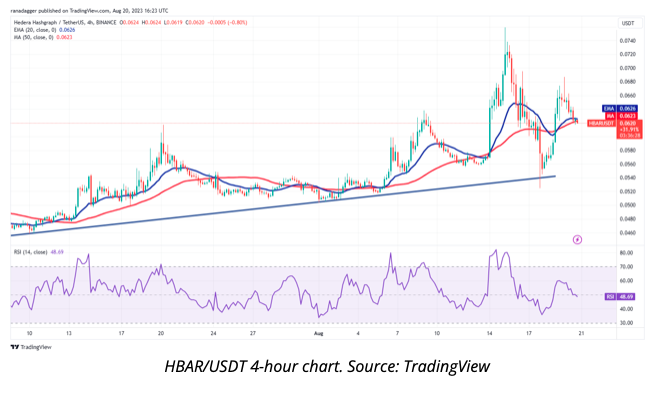
Recovery efforts are encountering resistance near the upper ceiling at $0.070, implying that the bears are still active and persistently selling during upward movements. The price trajectory has shifted downwards, approaching the moving averages, a significant level to monitor closely.
Should the price take an upward turn from its current position, it would signal the bulls’ intent to establish the moving averages as support. This might prompt buyers to mount another effort in breaching the resistance barrier at $0.070. A successful breakthrough could pave the way for a potential rally towards $0.075.
On the other hand, if the price experiences a sharp decline beneath the moving averages, it could result in the pair plummeting toward the uptrend line. Safeguarding this level becomes crucial for the bulls in this context.
Analysis of Optimism Price
Optimism (OP) recently crossed below the moving averages, yet it discovered support at the uptrend line, indicating a presence of demand at lower price levels.
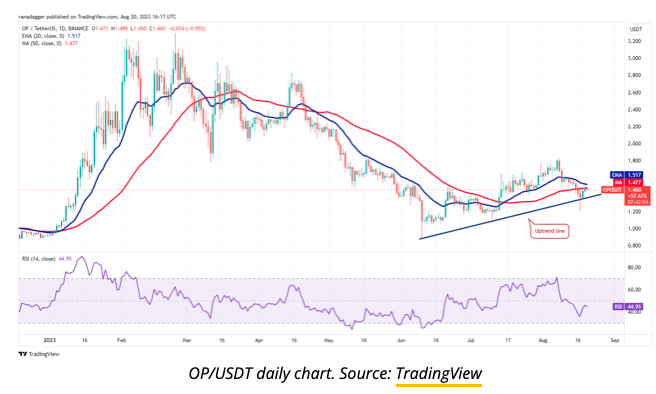
Having rebounded from the uptrend line, the price is currently encountering resistance at the 20-day EMA ($1.51). Unless a breakdown beneath the uptrend line occurs, the chances of an upswing above the 20-day EMA are likely to increase. In such a scenario, the OP/USDT pair might ascend toward the overhead resistance at $1.88.
However, if the price undergoes a reversal and drops below the uptrend line, it would imply that bears have taken command. This could lead the pair to initially descend to $1.21, followed by a potential further drop to $1.09.
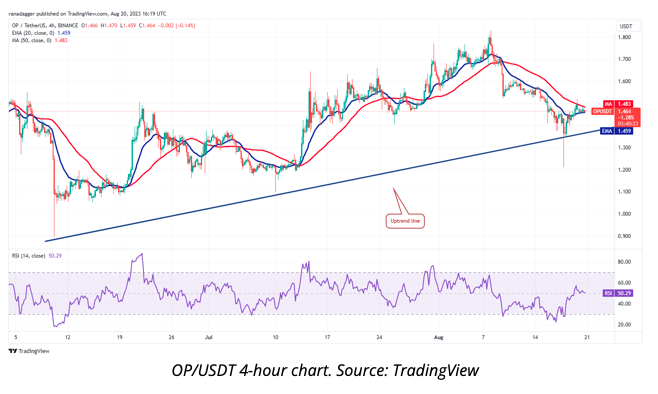
On the four-hour chart, it’s evident that the bears are attempting to impede the ongoing recovery as the price nears the 50-day SMA. Should the price conclude a session below the 20-day EMA, the subsequent target could be the uptrend line. A breach beneath this foundational support might signal the initiation of a more substantial decline.
In contrast, a different scenario emerges if the price reverses its course from its present position and successfully breaches the 50-day SMA. This would signify the commencement of a relief rally, potentially directing the pair toward the $1.61 level. Overcoming this threshold could then pave the way for the pair to progress further to $1.71.
Injective price analysis
In recent days, the price movement of Injective (INJ) has shaped a bullish ascending triangle pattern, suggesting a slight advantage for the buyers.
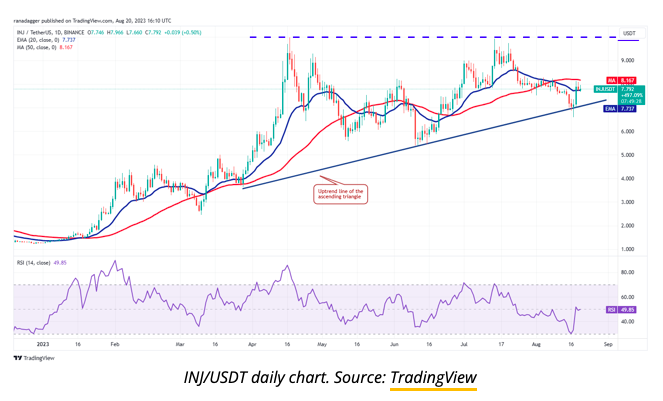
On August 17, the bears managed to drag the price below the uptrend line of the triangle; however, the candlestick’s extended lower tail points to robust buying activity at lower levels. Subsequently, on August 18, the bulls propelled the price above the 20-day EMA ($7.73), a level they’ve successfully maintained since. This hints at the bulls’ endeavors to transform the 20-day EMA into a supportive level.
A move beyond the 50-day SMA ($8.16) could indicate a resurgence of bullish control. This potential development might pave the way for a prospective rally toward $10. It’s essential to acknowledge that this optimistic perspective could be compromised in the short term if the price shifts downward and breaches the uptrend line. Under such circumstances, the INJ/USDT pair may experience a decline towards $5.40.
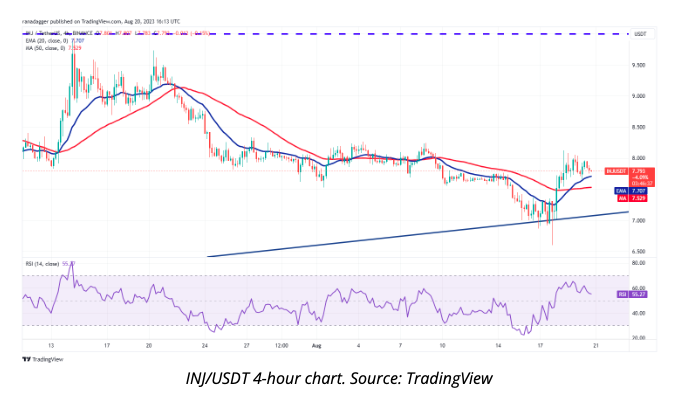
The four-hour chart reveals a robust rebound from the uptrend line, underscoring the bulls’ determined defense of this level. As the recovery progresses, it’s probable that there will be selling pressure encountered at the overhead resistance of $8.33.
Should the price shift downwards from its present point or the overhead resistance, yet subsequently recover above the 20-day EMA, it would signify the ongoing bullish inclination to purchase during dips. This would further bolster the likelihood of a breakthrough above the $8.33 mark. If this resistance is successfully surpassed, the pair could advance to $8.83, followed by a potential rise to $9.50.
The initial indication of weakening would manifest through a breach and close beneath the 50-day SMA. Such an occurrence might lead the pair towards the critical level of the uptrend line. Should this support level falter, the pair might undergo a descent to $6.50.
THORChain price analysis
Amidst the prevailing pressure on most altcoins, THORChain (RUNE), currently valued at $1.73, has been exhibiting an uptrend over the recent days.
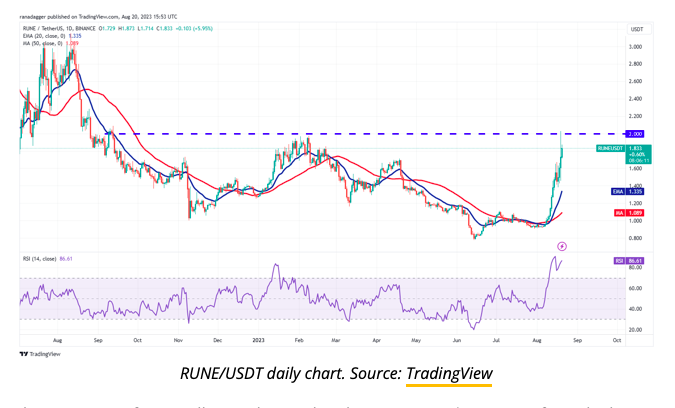
The upward movement has encountered selling pressure at the overhead resistance of $2, as evidenced by the extensive wick on the candlestick of August 19. The rapid surge over the past few days has propelled the RSI into a significantly overbought state, implying the potential for either consolidation or a minor corrective phase.
Should the bulls manage to maintain their position relatively well from the current level, it would enhance the likelihood of breaching the $2 threshold. In the event of such an achievement, the RUNE/USDT pair might initiate its advancement towards $2.30, followed by a subsequent target at $2.60.
Conversely, if the price undergoes a decline below $1.41, it would indicate the inception of a more profound correction, potentially targeting the 20-day EMA ($1.33).
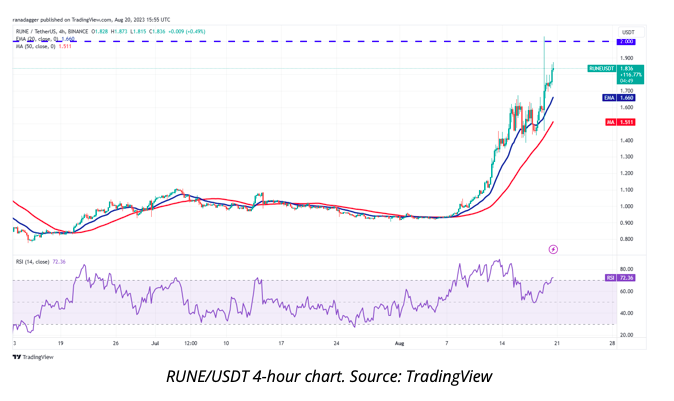
The four-hour chart displays an upward slope for both moving averages, and the RSI registers in the overbought region, suggesting a prevailing advantage for the bulls. Should the price manage to maintain levels above $1.80, the currency pair could potentially revisit the crucial resistance at $2.
On the contrary, if the price declines below $1.80, a potential descent towards the 20-day EMA becomes feasible. A robust rebound from this level would signify ongoing positive sentiment, with traders purchasing during declines. This would amplify the likelihood of a rally towards $2.
However, a price break below the 20-day EMA would signal a tendency for traders to sell during rallies. In this scenario, the pair might experience a decline towards the 50-day SMA, followed by a potential further drop to $1.38.


