


Once more, the Bitcoin price is sliding beneath the critical $26,500 support level, leaving BTC vulnerable to further declines below the $26,000 support in the immediate future.
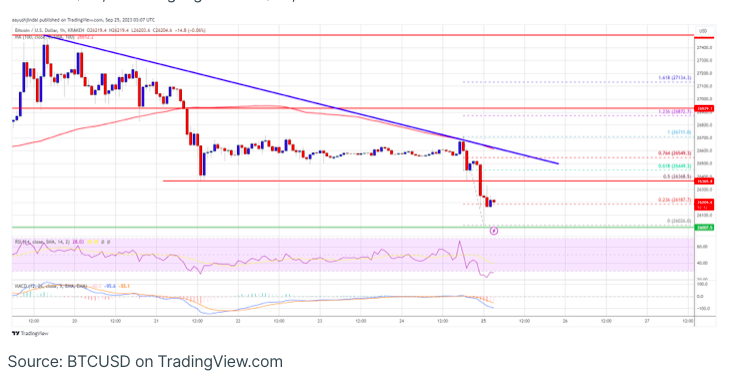
This decline began when Bitcoin was unable to overcome the $27,500 resistance. As of now, the price is positioned below $26,500 and the 100-hourly Simple Moving Average. Additionally, an important bearish trend line is forming, indicating resistance around $26,500 on the BTC/USD hourly chart sourced from Kraken. Consequently, the pair faces increased downside potential, potentially breaching the $26,000 level.
The price of Bitcoin is once again experiencing a decline.
Bitcoin faced resistance at the $27,500 mark and subsequently initiated a fresh decline. This decline saw BTC slip beneath both the $27,000 and $26,500 support levels, marking a shift into a bearish trend.
Furthermore, Bitcoin’s price dropped below the $26,200 support level and tested the $26,000 area. It reached a low point at approximately $26,026 before consolidating its losses. Presently, the cryptocurrency is trading slightly above the 23.6% Fibonacci retracement level of its recent drop from the $26,711 peak to the $26,026 low.
In the current scenario, Bitcoin is trading under $26,500 and remains below the 100-hourly Simple Moving Average. The immediate resistance to the upside can be found near the $26,350 level. The primary resistance levels include the $26,500 region, a connecting bearish trend line, and the 61.8% Fibonacci retracement level of the recent decline from the $26,711 swing high to the $26,026 low.
The upcoming significant resistance level is potentially around $26,700. If Bitcoin manages to surpass this point, it might trigger a bullish upturn. In such a scenario, there could be further upward movement towards the $27,000 resistance. Subsequent gains may even pave the way for an advance towards the $27,500 level.
More Losses In BTC?
Should Bitcoin fail to initiate a fresh upward movement beyond the $26,500 resistance, it may continue its descent. Immediate support to the downside is located around the $26,050 mark.
The subsequent significant support level rests near $26,000. A breakdown below and a close under the $26,000 threshold could potentially lead to further downward momentum, potentially targeting the next support level at $25,400 in the forthcoming sessions. If the bearish trend intensifies, a test of the $25,000 level may come into play.
Key Technical Indicators:
- Hourly MACD: The MACD is currently displaying a slowing pace within the bearish region.
- Hourly RSI (Relative Strength Index): The RSI for BTC/USD has dipped below the 50 level.
Major Support Levels: $26,000, followed by $25,400.
Major Resistance Levels: $26,350, $26,500, and $26,700.