Solana (SOL), while staging an impressive comeback, has exhibited a broader descending pattern in its price trajectory. The recent shift from $17.3 to $20.54 translated to an 18% profit for bullish investors. Nevertheless, surpassing the $20 mark may pose a formidable challenge.
Analysis of Solana
On the daily chart, there’s been a formation of a descending channel since July in the price movement. The recent recovery observed on September 11 rebounded from the channel’s lowest point at $17 and moderated within the mid-range, with a pause occurring near the upper range.
As of the current writing, the retracement could potentially lose momentum within the 12-hour bullish order block (OB) spanning from $18.3 to $19.5 (indicated in white). There’s a possibility of alignment with the mid-range of the OB, which might support a price reversal, provided that Bitcoin (BTC) doesn’t experience significant further declines in the medium term. Consequently, buyers may consider $16, $17.75, and the mid-range ($18) as crucial levels of interest.
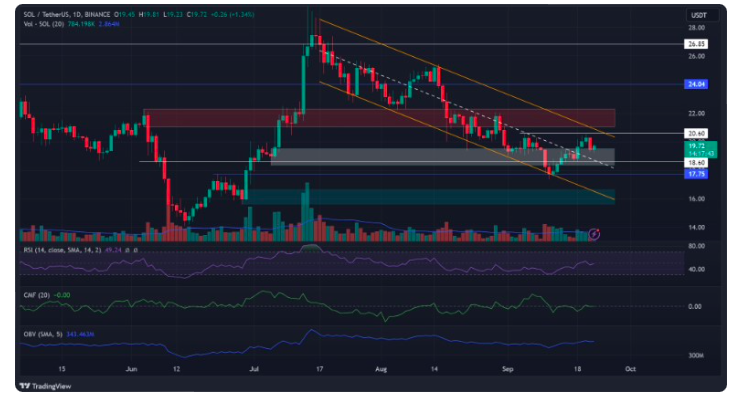
Nonetheless, the $20 mark represents a confluence of resistance levels. As of the present moment, SOL had not managed to breach the $20.60 threshold, and the daily timeframe exhibited a shift toward a bearish market structure. Notably, there exists a bearish order block (OB) above the December high, which could pose a challenge to surpassing $20, unless there’s a significant recovery in Bitcoin (BTC).
Looking at the On-Balance Volume (OBV), it appears that the recent recovery might have been influenced by demand in the spot market. However, both the Chaikin Money Flow (CMF) and Relative Strength Index (RSI) seemed to have stagnated near critical threshold levels, signaling a decrease in buying pressure and capital inflow.
The Prospects for Solana’s Future
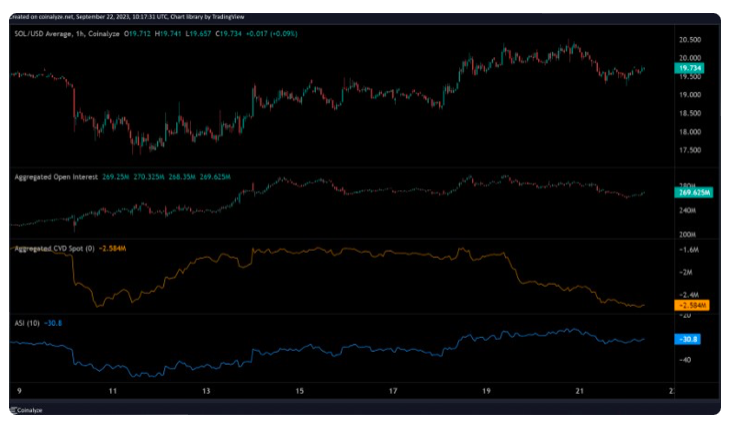
As suggested by Cumulative Volume Delta (CVD), it appears that sellers have increased their influence over the market due to the extended period of decline. Furthermore, there has been a decline in the Open Interest rate, which may indicate a modest decrease in demand.
Additionally, the negative reading on the Accumulation Swing Index (ASI) underscores that SOL’s price trajectory is entrenched in a prolonged downtrend. ASI assesses the intensity of price fluctuations, and a negative value signifies that sellers are strengthening their position, particularly on longer-term charts.