


On a broader scale, Ethereum’s price has been in a downtrend, nearly erasing all gains since the start of 2024. However, recent developments suggest that this trend could soon reverse.### Technical AnalysisBy Edris Derakhshi (TradingRage)**The Daily Chart**On the daily chart, Ethereum has been consolidating within a range of $2,100 to $2,700, with the downward momentum appearing to pause. Despite this, the market structure remains bearish, and the price needs to break above the $2,700 level to establish a higher high.That said, recent price movements suggest a potential bottom may be forming. While it’s too early to confirm, a new uptrend could be on the horizon, assuming the $2,100 support holds firm.

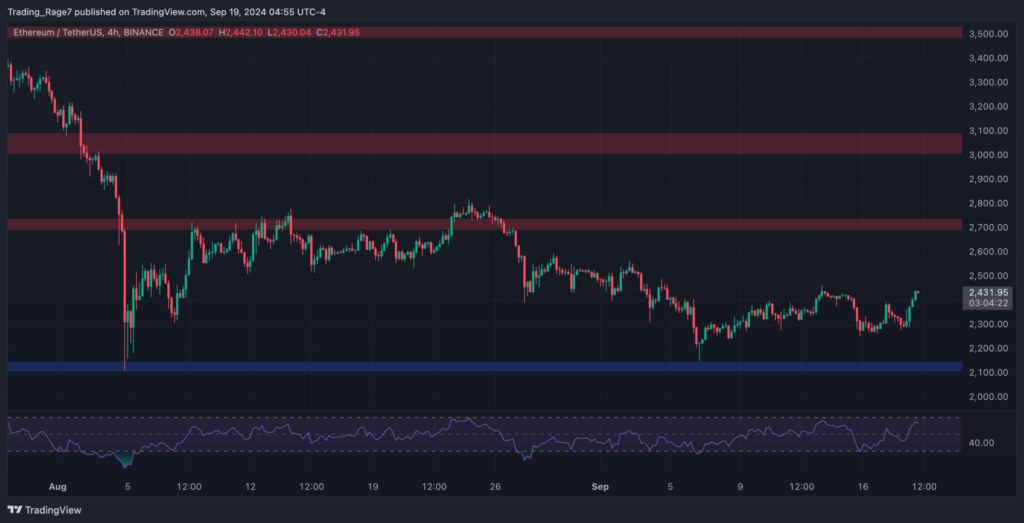
The 4-Hour Chart
The 4-hour chart provides a clearer view of recent price action. The market quickly rebounded from the $2,100 support zone and has been steadily climbing since.
Although momentum remains weak, the strengthening bullish candles suggest that an impulsive move toward the $2,700 resistance level may be on the horizon. It seems it could just be a matter of time before this occurs.
### Sentiment Analysis By Edris Derakhshi (TradingRage)**Ethereum Exchange Reserve** While technical analysis suggests Ethereum may be forming a price bottom, on-chain analysis raises some concerns. The Ethereum exchange reserve, which tracks the total amount of ETH held on exchanges, serves as a proxy for potential selling pressure, as these coins can be quickly sold.As the chart shows, the overall trend for the exchange reserve has been declining, indicating that investors have been accumulating since last year. However, short-term fluctuations are important, as each time the reserve has risen above its 30-day moving average, a price drop has typically followed.Currently, the exchange reserve is once again above its 30-day moving average, signaling the possibility of another price decline if demand does not increase to counter the rising supply.