


Ethereum Price Aims Higher Ground: What’s Next for ETH?
Ethereum has initiated a recovery wave, surpassing the $2,350 and $2,420 resistance levels. Although ETH remains below $2,640 and the 100-hour Simple Moving Average, it shows potential for bullish momentum if it can break through the $2,680 resistance zone.
Key Points:
- Recovery Wave: Ethereum began a recovery wave above the $2,350 and $2,420 levels.
- Current Trading Levels: The price is trading below $2,640 and the 100-hour Simple Moving Average.
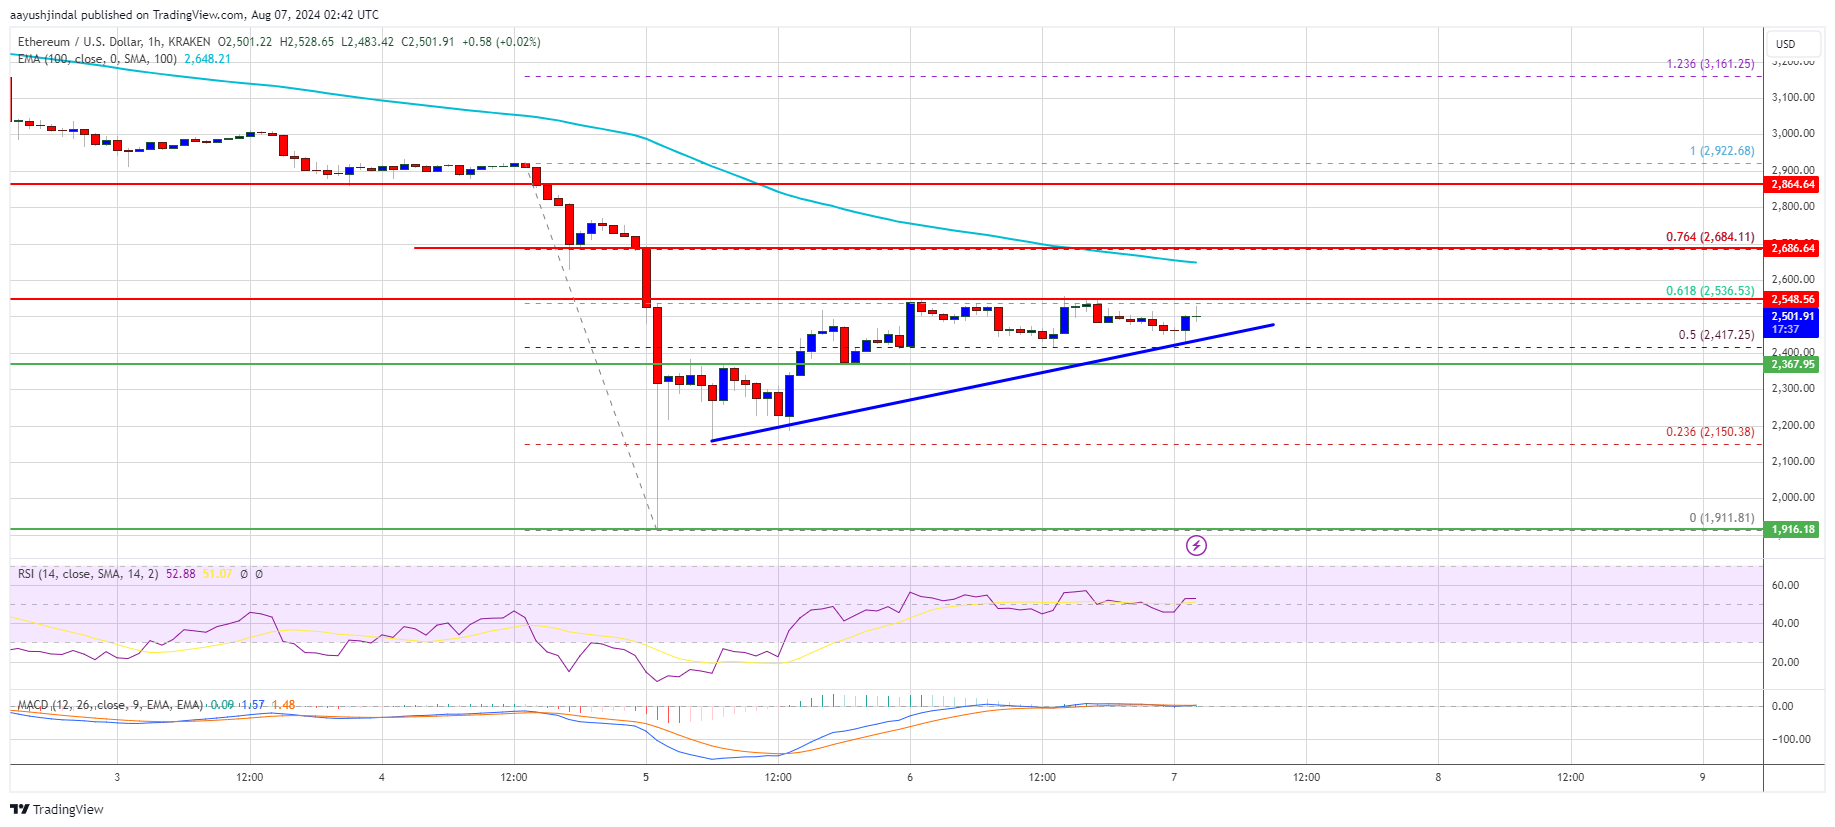
- Bullish Trend Line: A connecting bullish trend line with support at $2,440 is forming on the hourly chart of ETH/USD (data feed via Kraken).
- Potential Rise: The pair could rise steadily if it clears the $2,680 resistance zone.
Detailed Analysis
After a sharp decline below $2,000, Ethereum’s price has shown signs of recovery, moving past the $2,200 and $2,250 resistance levels, similar to Bitcoin’s rise above $65,000.
- Fib Retracement: The price climbed above the 50% Fib retracement level of the downward wave from the $2,920 swing high to the $1,910 swing low.
- Trend Line Support: There is a connecting bullish trend line forming with support at $2,440 on the hourly chart.
- Resistance Levels: Bears are active near the $2,540 and $2,550 levels.
Currently, Ethereum is trading below $2,650 and the 100-hour Simple Moving Average. On the upside, it faces resistance around the $2,540 level and the 61.8% Fib retracement level of the downward wave from the $2,920 swing high to the $1,910 swing low.
Ethereum Price Outlook: Key Levels to Watch
Resistance Levels:
- First Major Resistance: Near the $2,680 level and the 100-hour Simple Moving Average.
- Next Major Hurdle: Around the $2,720 level.
- Potential Breakout: A close above $2,720 could push Ether toward the $2,860 resistance.
- Further Resistance: Near $2,920. An upside break above this level might propel the price toward the $3,000 resistance zone in the near term.
Possible Decline in ETH:
- Failure to Clear Resistance: If Ethereum fails to break the $2,540 resistance, it could start another decline.
- Initial Support: Near $2,440 and the trend line zone.
- First Major Support: Around the $2,365 zone.
- Further Downside: A clear move below $2,365 could push the price toward $2,250. Additional losses might lead to a drop toward the $2,120 support level in the near term, with the next key support at $2,050.
Technical Indicators:
- Hourly MACD: The MACD for ETH/USD is gaining momentum in the bullish zone.
- Hourly RSI: The RSI for ETH/USD is now above the 50 zone.
Key Levels to Watch:
- Major Support Level: $2,365
- Major Resistance Level: $2,540