


Bitcoin Price Consolidates Below $68,500: Is Another Surge Imminent?
Bitcoin price has remained below the $68,500 resistance zone, entering a consolidation phase while maintaining its gains. BTC is currently trading above $66,800 and the 100-hourly Simple Moving Average, potentially gearing up for a fresh upward move.
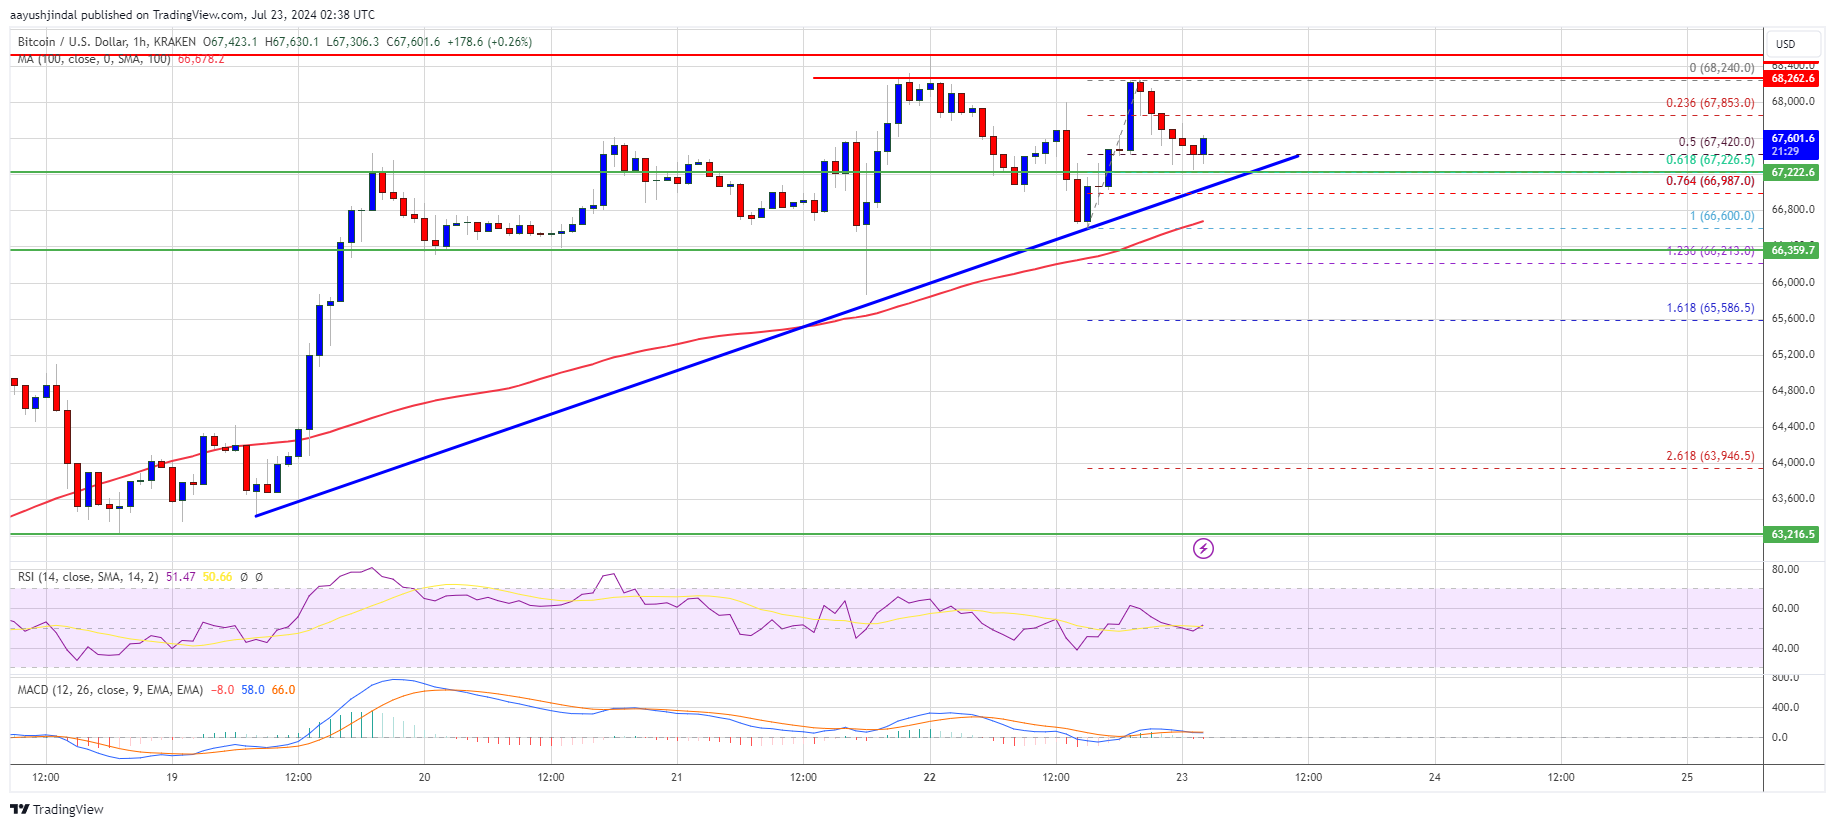
A key bullish trend line is forming with support at $62,200 on the hourly chart of the BTC/USD pair (data feed from Kraken), indicating that the pair might extend its gains and break above the $68,500 resistance zone soon.
Bitcoin Price Holds Steady Above $67K
Bitcoin price recently surged past the $66,500 and $67,000 resistance levels, even spiking above $68,000 before encountering bearish resistance near $68,500. The recent high was around $68,240, followed by a slight decline below $67,500.
The price dipped below the 50% Fib retracement level of the upward move from the $66,600 swing low to the $68,240 high but remained above $66,800 and the 100-hourly Simple Moving Average. A key bullish trend line with support at $62,200 on the hourly chart suggests strong underlying support, close to the 61.8% Fib retracement level of the upward move from $66,600 to $68,240.
Should Bitcoin experience a fresh increase, it may face initial resistance near $68,250, with the primary resistance at $68,500. A decisive move above this level could trigger another significant surge in the near term.
The next key resistance could be $68,800, with a major hurdle at $69,200. A close above the $69,200 resistance might propel the price higher, potentially testing the $70,000 resistance level.
Are BTC Dips Supported?
If Bitcoin fails to surpass the $68,250 resistance zone, it could initiate a downside correction. Immediate support on the downside is near the $67,200 level.
The first major support is at $66,600, followed by the next support near $66,000. Further losses might push the price toward the $65,500 support zone in the near term.
Technical indicators:
- Hourly MACD – The MACD is now losing pace in the bullish zone.
- Hourly RSI (Relative Strength Index) – The RSI for BTC/USD is currently above the 50 level.
Major Support Levels – $67,200, $66,600.
Major Resistance Levels – $68,200, $68,500.