


On Monday, July 13, Solana’s price surged past the $150 resistance level, marking a gain of over 25% from the weekend. Trading volume trends indicate aggressive buying activity, suggesting that SOL prices could continue to rise in the coming days.
Solana Price Breaks $150 Barrier Amid Surge in Weekend Demand
After a turbulent start to the month, sentiment in the broader crypto market has flipped bullish over the past 72 hours. Resurgent bull traders flocked to Solana over the weekend, driven by back-to-back dovish macroeconomic indicators from the latest US Non-Farm Jobs and Consumer Price Index (CPI) data.
This weekend’s buying frenzy has triggered a significant rebound in SOL’s price, validating bullish speculations that the Ethereum ETF launch could pave the way for approval of Solana’s spot ETF, filed by VanEck in late June.
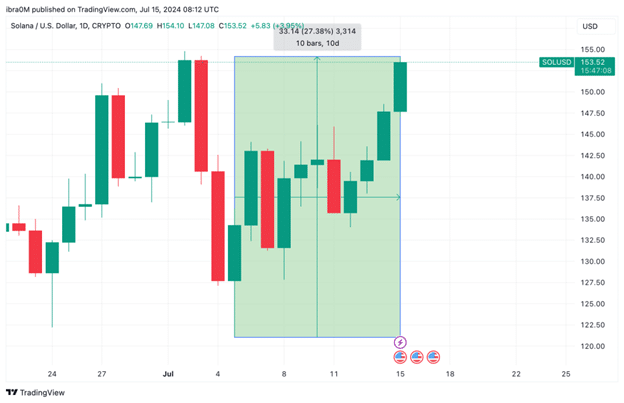
Solana Price Action SOLUSD | TradingView
On Friday, July 5, Solana’s price bottomed out at $121.40 as traders anticipated another hawkish CPI data release that could dampen the prospects of a US Fed rate cut. However, the June 2024 CPI data came in dovish, triggering a rapid demand surge across the crypto markets.
Fueled by positive momentum from its own ETF speculations, Solana has emerged as one of the biggest gainers in the current bullish market phase. As of July 13, Solana’s price had surged 27% from Friday’s lows, breaching the $150 resistance and reaching as high as $154 around 10 am CET on Monday.
Solana’s $1.9B trading volume suggests more gains ahead.
Solana’s $1.9B Trading Volume Signals Potential for Further Gains
While most of the top 20 ranked crypto assets have seen substantial gains over the past three days, a key market data point indicates that Solana bulls are trading more aggressively. This activity could potentially trigger a major breakout towards the $200 mark in the coming weeks.
The Coinglass chart below tracks the daily volume of Solana transactions across various exchanges. By comparing trading volume trends to price movements, investors can gain insights into short-term market momentum.
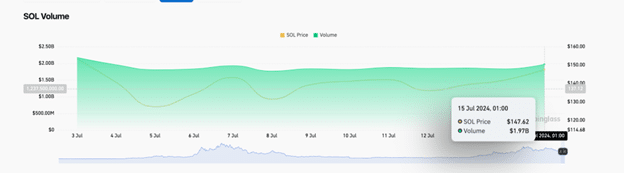
Solana Price vs SOL Trading Volume SOLUSD | TradingView
At the close of Friday, July 5, Solana’s trading volume reached $1.85 billion while the price fell to a weekly low of $121. However, following a buying frenzy over the weekend, Solana’s price surged by 27% to hit $154. Meanwhile, trading volume only increased by 6.4% to reach $1.97 billion as of Monday, July 15.
This indicates that while SOL’s price has risen by more than 27% in the last three days, its trading volume has only increased by 6.4%. When an asset’s price increases at a faster rate than its trading volume, strategic traders often view it as a bullish signal for two key reasons.
First, this scenario suggests strong demand for the asset, with buyers willing to pay higher prices even without a proportionate increase in the number of transactions. This indicates investor confidence and positive market sentiment, as evidenced by Solana’s recent price surge despite only a modest rise in trading volume.
Second, a rapid price increase relative to trading volume can reflect the actions of large investors, or “whales,” who strategically accumulate the asset without significantly affecting the trading volume. These large purchases can drive prices up quickly, signaling that big players expect further price appreciation.
In Solana’s case, the 27% price increase over the weekend, coupled with only a 6.4% rise in volume, might indicate that whale investors are betting on Solana’s future growth, particularly in response to VanEck’s recent application for Solana spot ETFs.
Solana Price Forecast: $200 Target Now Viable
As of July 15, Solana (SOL) has shown impressive price action, currently trading at $153.90. The recent surge has resulted in a 27.38% increase over the last 10 days, with the price moving from $121.55 to $154.10. This bullish momentum is supported by technical indicators suggesting a potential continuation towards the $200 target, although some caution is warranted.
The Parabolic SAR (Stop and Reverse) indicator shows a bullish trend, with dots appearing below the price, indicating upward momentum. The Relative Strength Index (RSI) is at 42.19, which is below the overbought threshold, suggesting there is room for further upside before the price becomes overextended. Additionally, the Fibonacci retracement levels indicate potential resistance at $160, $172, and $176, aligning with previous highs and psychological barriers.
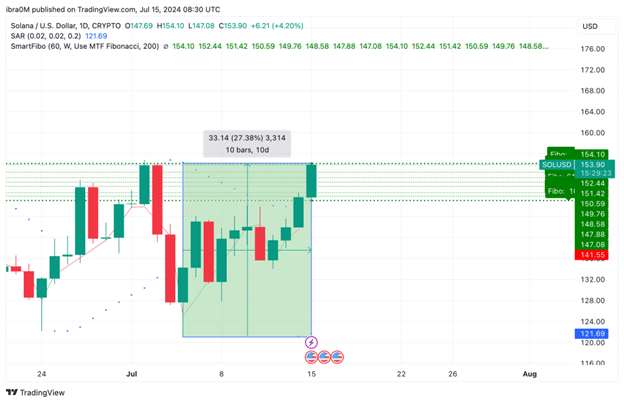
Solana Price Forecast SOLUSD | TradingView
Despite the optimistic outlook, the recent price increase has not been accompanied by a substantial rise in trading volume, which only saw a 6.4% increase to $1.97 billion. This discrepancy between price and volume may indicate caution among investors, as sustainable rallies typically rely on robust volume support.
Nevertheless, current market sentiment remains positive, buoyed by broader bullish trends in the cryptocurrency market and recent favorable macroeconomic data.
In summary, while Solana’s technical indicators and recent price movements suggest a viable path towards $200, traders should carefully monitor critical support and resistance levels. Sustained upward movement above $160, coupled with increased trading volume, will be crucial to confirm the bullish trend and achieve higher price targets.