

 Faces Crucial Test at $80: Market Stability in Focus")
In this analysis, we’ll delve into Litecoin’s (LTC) recent price movements and on-chain activity to grasp the underlying patterns and potential mid-term trajectories.
Bitcoin’s challenges in surpassing the $61K price mark have exerted downward pressure on LTC, causing it to trade beneath the pivotal $80 support threshold. What factors are influencing this behavior? Let’s explore further.
LTC Hovers Slightly Above a Crucial Support Threshold
In the provided chart, we analyze Litecoin’s price dynamics within the 4-hour timeframe, with key support and resistance levels highlighted by red lines. Presently, the price stands at approximately $79. Should it dip below the $75 range, it could prompt a series of liquidations, potentially driving further price declines.
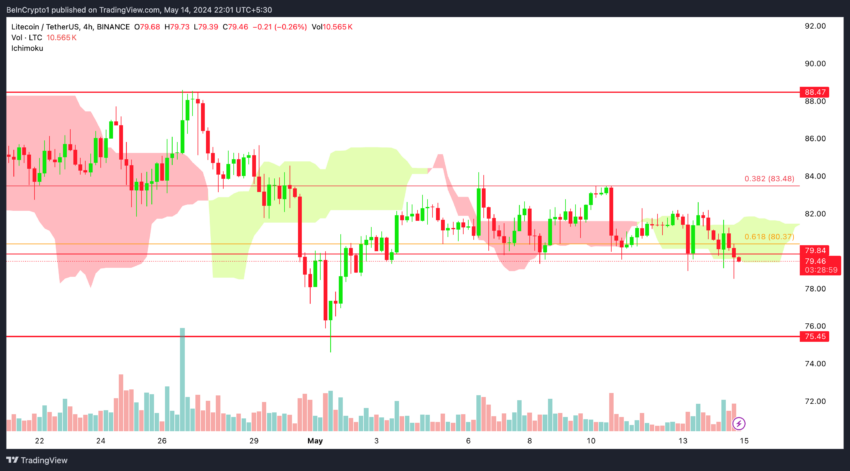
The level at $80.37, in proximity to the $80 threshold, corresponds with the 0.618 Fibonacci retracement level, serving as significant mid-term support.
Litecoin’s price has recently tested breaking below the 4-hour Ichimoku Cloud. A closure beneath the cloud may escalate volatility, potentially prolonging a mid-term price correction towards $75.
For more insights: Litecoin (LTC) Price Prediction 2024/2025/2030
Failure to breach above the cloud could indicate a prospective reversal in trend.
Insights from Spent Volume Across Age Groups Unveil Crucial Market Trends
The charts depict spent outputs categorized into age bands. Green bars illustrate LTC held for 1 hour to 24 hours before expenditure, blue bars denote LTC held for 1 day to 1 week, light green bars represent LTC held for 1 week to 1 month, and red bars indicate LTC held for 1 month to 3 months. The black line tracks LTC price in USD.
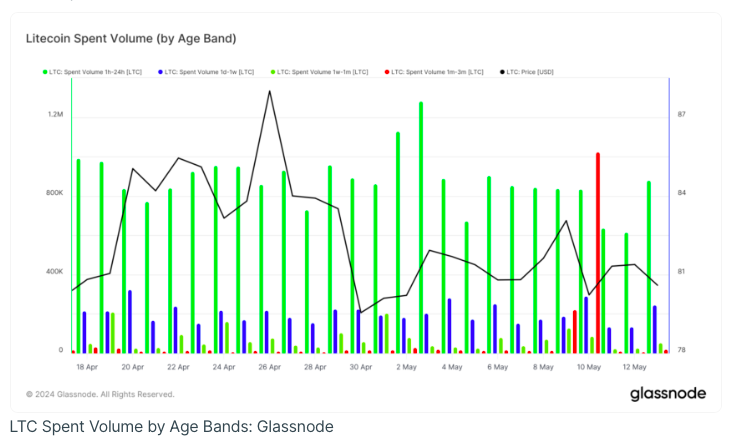
The highest volume of spending occurs within the 1-hour to 24-hour window, averaging 800K LTC per day, suggesting significant short-term trading activity. This rapid turnover can contribute to heightened price volatility.
For further information: How To Buy Litecoin (LTC) and Everything You Need To Know
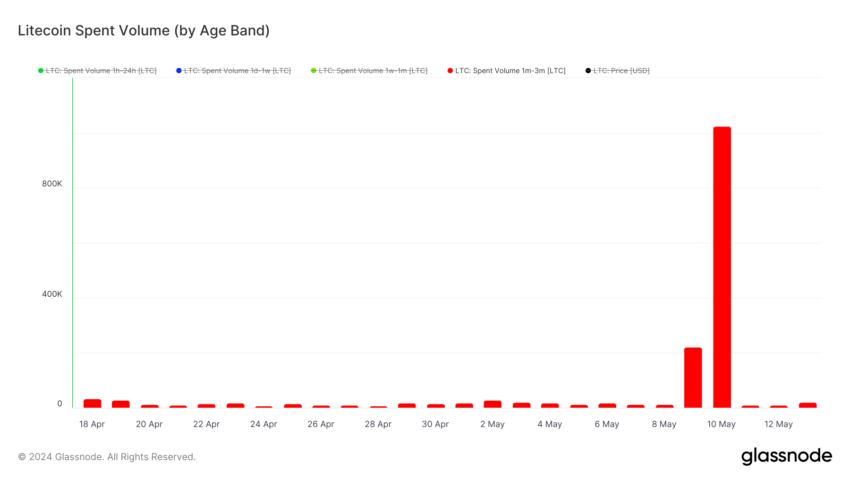
On May 10, there was a notable sell-off by mid-term holders, individuals holding LTC for 1 to 3 months. This occurrence might signal a shift in sentiment or profit-taking actions. Such spikes can result in mid-term price declines.
Strategic Decision-Making and Future Prospects of Litecoin
Shift from Bearish to Neutral: LTC’s price struggles below the critical $80 support level, exhibiting vulnerability following Bitcoin’s hurdles around the $61,000 threshold. This has instilled apprehension among holders, prompting short-term investors to exit positions to limit losses.
Contingent Support: If Bitcoin dips below $61,000, LTC could undergo a significant mid-term price decline towards $75.
Price Forecasts and Recommendations: Under a bearish scenario, LTC might regress to $70 should Bitcoin’s price descend to $59,000. To mitigate risk exposure, traders are advised to wait for the price to dip below $75 before initiating purchases. The optimal entry range would be approximately $70-$72 for an advantageous position. Implementing a stop-loss at $68 is recommended to manage potential downward risks, while aiming for a sell price range of $85-$90 to capitalize on the forthcoming upward momentum.