


Bitcoin price is rising and now trading above $70,000 resistance zone. BTC could continue to rise toward the $73,000 and $75,000 levels in the near term.
- Bitcoin price remained in a positive zone above the $66,500 level.
- The price is trading above $70,000 and the 100 hourly Simple moving average.
- There is a connecting bullish trend line forming with support at $67,500 on the hourly chart of the BTC/USD pair (data feed from Kraken).
- The pair could continue to rise if it clears the $71,200 resistance zone.
Bitcoin’s Price Begins Rising Again
The Bitcoin price demonstrated resilience, maintaining stability above the $65,000 resistance zone. It surged beyond the $67,500 and $68,000 resistance thresholds, with bullish momentum propelling it above $68,800 and eventually $70,000.
Reaching a new weekly peak near $71,217, the price is presently consolidating its gains. Currently, it hovers near the 23.6% Fibonacci retracement level of the upward swing from the $66,810 low to the $71,217 high. Bitcoin remains above $70,000 and the 100-hourly Simple Moving Average.
On the hourly chart of the BTC/USD pair, a bullish trend line is emerging, providing support around $67,500. This trend line aligns closely with the 76.4% Fibonacci retracement level of the aforementioned upward move from $66,810 to $71,217.
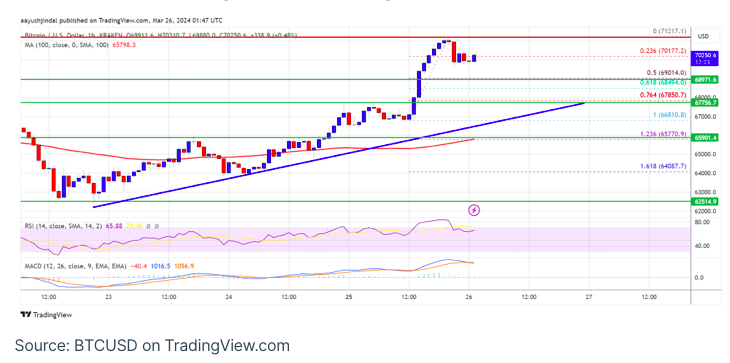
The $70,500 level poses immediate resistance, followed by a significant hurdle around $71,200. A decisive breakthrough above this level could signify further bullish momentum. Should this scenario materialize, the price might advance beyond the $73,500 resistance area in the short term. The subsequent critical resistance lies at $75,000.
Is BTC Headed for Another Decline?
Should Bitcoin fail to surpass the $71,200 resistance area, it could initiate another downward movement. Immediate support awaits near the $70,000 mark.
The primary support level is at $69,000, with the subsequent support at $67,800 coinciding with the trend line. A close below $67,800 may trigger a descent towards the $66,800 level. Further losses could lead the price towards the $65,500 support zone in the short term.
Technical Indicators:
Hourly MACD – The MACD is displaying a decrease in bullish momentum.
Hourly RSI (Relative Strength Index) – The RSI for BTC/USD is currently above the 60 level.
Key Support Levels – $69,000, followed by $67,800.
Key Resistance Levels – $70,500, $71,200, and $73,500.