

 Cycle Assessment: Anticipating a pinnacle at $155,000 by August 2025.")
This week, Bitcoin achieved a noteworthy milestone by reaching its all-time high (ATH) of $69,000 since November 2021. After a span of 847 days, the leading cryptocurrency has reclaimed the summit of the preceding cycle, hinting at a potential entry into price discovery territory once again.
This significant occurrence presents an opportune moment to analyze data from past Bitcoin cycles. Conducting long-term technical assessments of prior cycles enables us to project the peak of BTC prices for the current cycle and the anticipated timeframe for its realization.
The forthcoming Bitcoin halving could potentially remain a fundamental factor in delineating the 4-year cycles within the cryptocurrency market. If this hypothesis holds, a new bullish phase might propel the BTC price to a range between $155,000 and $175,000, with the culmination expected sometime between April and August 2025.
The ebbs and flows of Bitcoin’s historical cycles.
Analyzing historical cycles yields the primary dataset of Bitcoin’s price lows and peaks. Estimating the cycle’s probable zenith involves gauging the diminishing proportion within the price range of successive cycles.
The initial ascent, commencing with BTC valued at $0.01, culminated in a peak at $31.90 in June 2011. Subsequently, Bitcoin descended to a low of $2.01 in November 2011, marking the nadir of the first cycle.
This marked the onset of a bullish phase following the first halving in November 2012. Bitcoin’s price surged to a historic all-time high (ATH) of $1,177 in November 2013, reflecting a staggering 586x increase. The subsequent 2014 bear market led to a macro bottom at $164 in January 2015. From then until December 2017, Bitcoin underwent another prolonged uptrend.
Simultaneously, the second BTC halving occurred in July 2016, preceding the peak of the BTC price at $19,764. In the second cycle, the price of BTC witnessed a noteworthy 121x increment.
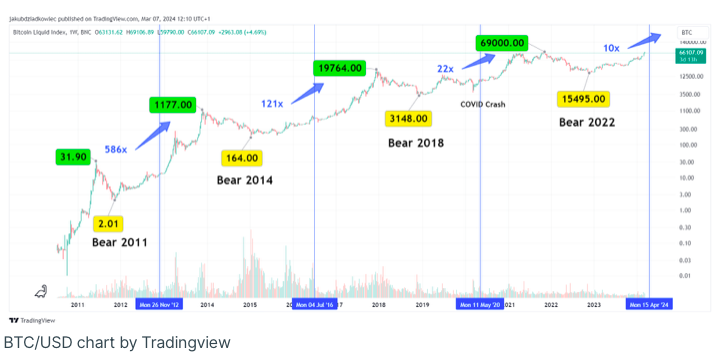
A subsequent bear market in 2018 saw Bitcoin reaching a bottom at $3,148 in December of that year. The upward trajectory that ensued was briefly interrupted by the COVID-19 crash in March 2020.
Nevertheless, post the third halving in May 2020, the BTC price embarked on a parabolic ascent. This upward journey concluded with a double peak formation, reaching the current all-time high (ATH) of $69,000 in November 2021. Throughout the third cycle, Bitcoin witnessed a remarkable 22x increase.
Forecasting BTC Prices Utilizing Cyclical Multiplier Approach
The latest conclusive macro period in BTC price history is the 2022 bear market, where the primary cryptocurrency reached a macro bottom at $15,495 in November 2022. Since then, there has been a steady ascent in the price, culminating in a new all-time high (ATH) this week.
Considering historical data and the descending sequence of multipliers from successive cycles:
- Cycle 1: 586x
- Cycle 2: 121x
- Cycle 3: 22x
- Prediction for the current cycle: 10x
If Bitcoin were to undergo a 10x increase during this cycle, the projected peak would be around $155,000. This figure represents approximately 2.2x of the current ATH at $69,000.
Examining the historical trend of BTC prices surpassing their previous ATH:
- Cycle 1: 37x
- Cycle 2: 16x
- Cycle 3: 3.5x
- Prediction for the current cycle: 2.2x
Therefore, a new peak for Bitcoin that is 2.2x higher than the current ATH would align with the historical pattern, indicating that such an outcome would not be unexpected.

Hence, the prudent objective of $155,000 aligns with the historical multipliers of BTC prices, considering the progression from macro lows to peaks and the increments beyond the preceding all-time high.
Bitcoin’s price zenith anticipated between April and August 2025.
An alternative method to gauge the dynamics of Bitcoin’s ongoing cycle is by measuring the time elapsed after each successive all-time high. This approach allows for approximating when the cryptocurrency market might enter a state of extreme euphoria, signaling the crucial moment to close positions as the possibility of a bear market looms.
This measurement can be approached in at least two ways: first, by measuring from the previous all-time high to the next peak (green), and second, by measuring from the halving to the all-time high (blue). Analyzing data from previous cycles yields the following results:
- Cycle 1: 129 weeks (green) and 52 weeks (blue)
- Cycle 2: 211 weeks (green) and 75 weeks (blue)
- Cycle 3: 204 weeks (green) and 78 weeks (blue)
- Prediction for the current cycle: 181 weeks (green) and 68 weeks (blue)
To derive the prediction for the current cycle, the arithmetic average is calculated from historical data. Consequently, the anticipated date range for a potential BTC price cycle peak falls between the end of April and the beginning of August 2025, as indicated by the red area.

Fibonacci levels indicate a potential peak at $175,000.
An additional method for gauging the end-of-cycle BTC price involves Fibonacci (Fib) retracement levels. This entails measuring the Fib retracement from the cycle peak to the macro bottom and utilizing the external Fib retracement above the previous all-time high to ascertain the BTC price’s position in the subsequent cycle.
Once again, it becomes evident that in successive cycles, the BTC price attains progressively lower Fib levels on the logarithmic scale. Notably, an exception arises in the second cycle, where the $19,764 peak reached the 2,414 Fib level, whereas in the first cycle, it was slightly lower at 2,272 Fib.
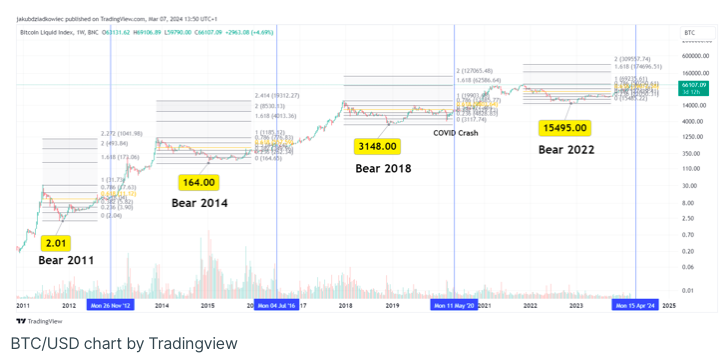
Nevertheless, in the preceding third cycle, the Bitcoin price only reached the 1.628 Fib external retracement of the prior cycle. This represents the initial and commonly targeted level during price discovery phases above historical all-time highs.
Should this pattern repeat in the current cycle, Bitcoin would have peaked at $175,000. However, insights derived from the price multipliers of previous cycles and the increments beyond the previous all-time high indicate a more likely peak at $155,000.
Consequently, we can infer that the $155,000 to $175,000 range is the most probable target for a new all-time high in this cycle of the Bitcoin market. Simultaneously, maintaining temporal similarities with past cycles suggests that this event is likely to occur between April and August 2025.
For the latest crypto market analysis from BeInCrypto, refer to their recent updates.