


Ethereum has surged through both psychological and technical milestones, demonstrating heightened volatility and drawing renewed interest from investors. The ETH/USD pairing on Kraken has experienced a significant upward breakthrough, surpassing the crucial $2,000 threshold and challenging the resistance at $2,136. This sets the stage for potential future price movements.
A closer look at Ethereum’s daily chart reveals a robust bullish trend that has captured the attention of the cryptocurrency community. The cryptocurrency has successfully breached the $2,000 barrier, leading to a noticeable spike in market volatility. This is evident in the larger candlestick sizes and increased trading volume, signaling an intense struggle for control between buyers and sellers.
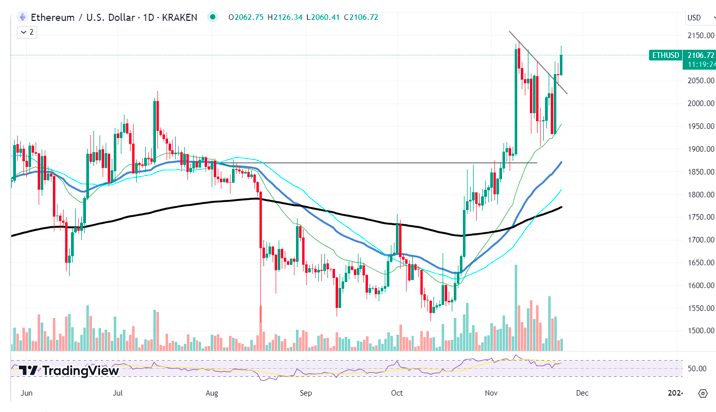
The $2,136 resistance level adds an intriguing element, having historically acted as a barrier to Ethereum’s upward trajectory. Nevertheless, the current market’s resilience, demonstrated by successfully overcoming nearby resistance levels, suggests a forthcoming attempt to breach this obstacle. Establishing a stable position above this price point may signal the beginning of a new phase of price exploration for Ethereum.
The convergence of moving averages on the chart, with the 50-day moving average crossing over the 100-day line, is a pattern often interpreted by traders as bullish. However, caution is warranted as the Relative Strength Index (RSI) is approaching overbought levels, potentially indicating an imminent pullback as investors consider locking in gains.
Another notable development is the emergence of what appears to be a bullish pennant formation—a pattern implying a continuation of the recent upward price trend following a consolidation period. A convincing breakout from this pattern could indicate Ethereum setting its sights on uncharted territory.
Traders recognize that a resistance level like $2,136 represents more than just a numerical value—it signifies a zone where various trading strategies and orders intersect, serving as a crucial gauge of market sentiment. As Ethereum approaches this pivotal level, it becomes a true test of whether the market can sustain its bullish momentum.
XRP stands firm.
XRP is currently hovering near a local resistance point, exemplified by recent peaks around $0.65. This level holds significance, consistently acting as a hurdle to upward price movements, revealing instances where selling pressure has outweighed buying activity. Close monitoring of this price threshold is essential for investors; surpassing it may signal an imminent upward surge, reflecting substantial buy-side interest and a positive market outlook.
Equally crucial are the support levels, with notable support for XRP at approximately $0.55. Traditionally serving as a foundation, this price point has prevented further declines by attracting increased purchasing. Investors must attentively track this support level, as a breach could suggest a looming downward trend, heightening the risk of liquidation for those with leveraged positions.
Examining the chart’s Moving Average (MA) lines reveals a recent “Golden Cross,” with the 50-day MA (in light blue) ascending past the 200-day MA (in black), a generally bullish signal. However, caution is advised, given that the 100-day MA (in dark blue) is still trailing below the 200-day MA.
The Relative Strength Index (RSI) currently hovers around the middle, indicating no immediate reversal, as it avoids both overbought and oversold conditions. Nevertheless, traders should remain vigilant for abrupt shifts toward the high or low ends of the scale, as such movements could foreshadow an upcoming change in price direction.