


Bitcoin is demonstrating optimistic indicators as it surpasses the resistance at $37,000. The cryptocurrency appears poised for an upward breakthrough beyond the $38,000 resistance threshold.
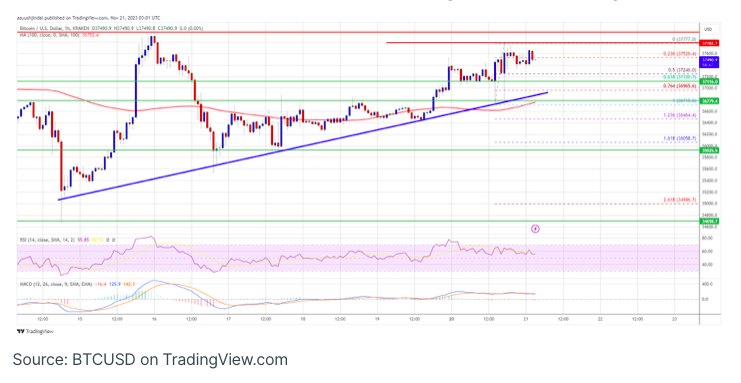
Initiating a new uptrend, Bitcoin has ascended above the $37,000 mark and is currently trading above both $37,000 and the 100-hourly Simple Moving Average. The hourly chart for the BTC/USD pair from Kraken reveals the formation of a significant bullish trend line, offering support in the vicinity of $36,950.
The potential for bullish momentum is evident, particularly upon successfully surpassing key levels at $37,800 and $38,000.
The upward movement in Bitcoin’s price continues.
Bitcoin’s price exhibited stability before initiating a fresh uptrend above the $36,000 threshold. The cryptocurrency surpassed $37,000, entering a positive zone and averting further downward trends.
The upward surge extended beyond the $37,350 mark, reaching a peak around $37,777, and the current scenario involves consolidating these gains. The price is presently hovering near the 23.6% Fibonacci retracement level of the upward movement from the $36,715 swing low to the $37,777 high.
Bitcoin is maintaining levels above $37,000 and the 100-hourly Simple Moving Average. Additionally, a significant bullish trend line is taking shape, providing support around $36,950 on the BTC/USD pair’s hourly chart.
Looking ahead, the immediate resistance lies in the vicinity of $37,800, with the primary hurdle persisting around the $38,000 mark. A successful breach of the $38,000 resistance could catalyze another robust upward movement.
The upcoming significant resistance might emerge around $38,800. A decisive breakthrough above this resistance could propel the price to advance even further, targeting the $39,200 level. Under these circumstances, there’s potential for a test of the $40,000 level, and any additional gains could drive Bitcoin towards the $41,200 mark.
Could BTC Experience Another Downturn?
Should Bitcoin be unable to surpass the resistance zone at $37,800, a downside correction may ensue. Immediate support on the downward side is anticipated around the $37,120 level or the 61.8% Fibonacci retracement level, calculated from the upward movement between the $36,715 swing low and the $37,777 high.
The subsequent significant support levels include $37,000 and the trend line. A breach below $37,000 poses the risk of further downsides, potentially leading the price toward the $36,780 support in the short term. If this support is not sustained, the next critical support or target might be at $36,200.
Technical indicators indicate that the hourly MACD is decelerating in the bullish zone, while the hourly RSI (Relative Strength Index) for BTC/USD is presently above the 50 level.
Key support levels to monitor are $37,120 and $37,000, while important resistance levels include $37,800, $38,000, and $38,800.